
Creating a D3.js Bar Chart in SPFx Web Part
In this article, we’ll learn how to create a bar chart using D3.js within a SharePoint Framework (SPFx) web part. D3.js is a powerful library for visualizing data using web standards. We’ll fetch data from a SharePoint list and render a bar chart based on that data.
Prerequisites
Before we begin, ensure you have the following:
- Basic knowledge of React and SPFx.
- An SPFx development environment set up.
- A SharePoint list containing data (e.g., a “Sales” list with columns for
TitleandSalesAmount).
Step 1: Install D3.js
First, we need to install D3.js and its TypeScript definitions in our SPFx project. Run the following commands in your project directory:
npm install d3
npm install --save-dev @types/d3
Step 2: Create the BarChart Component
Next, we’ll create a new React component named BarChart.tsx. This component will handle data fetching and rendering the bar chart using D3.js.
BarChart.tsx
import * as React from 'react';
import * as d3 from 'd3';
interface IData {
label: string;
value: number;
}
interface IBarChartProps {
sp: any; // Accepting sp as a prop
}
interface IBarChartState {
data: IData[]; // Holds the data for the bar chart
}
class BarChart extends React.Component<IBarChartProps, IBarChartState> {
private svgRef = React.createRef<SVGSVGElement>();
constructor(props: IBarChartProps) {
super(props);
this.state = {
data: [] // Initialize with empty data
};
}
public componentDidMount(): void {
this._getSalesData();
}
private async _getSalesData(): Promise<void> {
try {
const items: any[] = await this.props.sp.web.lists.getByTitle('sales').items.select('Title', 'SalesAmount')();
const data: IData[] = items.map(item => ({
label: item.Title,
value: item.SalesAmount,
}));
this.setState({ data }, this.renderChart); // Update state and then render the chart
} catch (error) {
console.error("Error fetching data from list: ", error);
}
}
private renderChart(): void {
const { data } = this.state;
const svg = d3.select(this.svgRef.current);
const width = 500;
const height = 300;
const margin = { top: 20, right: 30, bottom: 40, left: 40 };
svg.attr('width', width).attr('height', height);
const x = d3.scaleBand<string>()
.domain(data.map(d => d.label))
.range([margin.left, width - margin.right])
.padding(0.1);
const maxValue = d3.max(data, (d: IData) => d.value) as number || 0;
const y = d3.scaleLinear<number, number>()
.domain([0, maxValue])
.nice()
.range([height - margin.bottom, margin.top]);
// Clear previous content
svg.selectAll('*').remove();
svg.append('g')
.attr('transform', `translate(0,${height - margin.bottom})`)
.call(d3.axisBottom(x));
svg.append('g')
.attr('transform', `translate(${margin.left},0)`)
.call(d3.axisLeft(y));
svg.selectAll('.bar')
.data(data)
.enter()
.append('rect')
.attr('class', 'bar')
.attr('x', (d: IData) => x(d.label)!)
.attr('y', (d: IData) => y(d.value))
.attr('height', (d: IData) => y(0) - y(d.value))
.attr('width', x.bandwidth());
}
public render(): React.ReactElement<IBarChartProps> {
return (
<div>
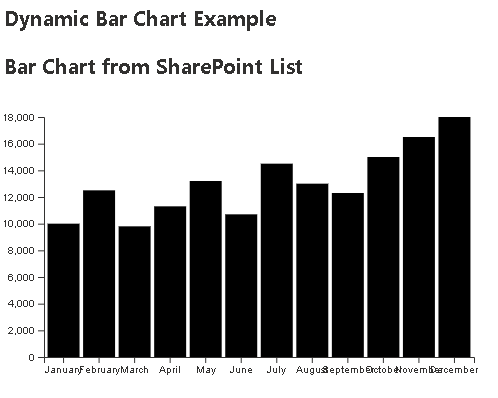
<h2>Bar Chart from SharePoint List</h2>
<svg ref={this.svgRef}></svg>
</div>
);
}
}
export default BarChart;
Code Explanation
- Props and State:
- The
IBarChartPropsinterface defines thespprop to access SharePoint data. - The
IBarChartStateinterface holds the chart data.
- Data Fetching:
componentDidMount: This lifecycle method fetches the sales data once the component mounts._getSalesData: Fetches items from the “Sales” SharePoint list and maps them into the required format.
- D3 Chart Rendering:
renderChart: This method creates the D3 bar chart after the data has been fetched.- The SVG element is updated with axes and bars representing the sales data.
- SVG and D3 Setup:
- The chart dimensions and margins are defined.
- D3 scales and axes are created and rendered within the SVG.
Step 3: Integrate the BarChart Component in Your Web Part
Now that we have our BarChart component, we need to integrate it into our SPFx web part. Ensure you pass the sp instance to the component.
Example Integration in Your Web Part
import * as React from 'react';
import { BarChart } from './components/BarChart';

export default class MyWebPart extends React.Component {
  // Your web part logic...

  public render(): React.ReactElement {
    return (
      <div>
        <BarChart sp={this.props.sp} />
      </div>
    );
  }
}
Conclusion
In this article, we’ve created a D3.js bar chart in an SPFx web part, demonstrating how to fetch data from a SharePoint list and visualize it. D3.js offers extensive capabilities for data visualization, making it a valuable tool in your development arsenal.

Leave a comment