
Introduction to Recharts and How to Use It with SPFx
In modern web development, visualizing data with interactive charts has become essential. Whether you are building dashboards, reports, or analytics platforms, having easy-to-use charting libraries makes a difference. Recharts is a simple, responsive charting library built on React and D3, designed to handle a wide variety of chart types with minimal setup. It provides an easy API for creating interactive and customizable charts.
In this article, we will introduce Recharts and walk through an example of integrating it into a SharePoint Framework (SPFx) web part, ensuring that you can easily display dynamic chart data pulled from SharePoint lists.
Why Use Recharts?
Recharts is widely used for:
- Ease of Use: It has a straightforward API, making it easy to create various chart types like bar charts, line charts, pie charts, etc.
- React Integration: Recharts is built specifically for React, meaning it integrates seamlessly with React components and hooks.
- Responsive Design: It automatically adjusts to different screen sizes.
- Customizable: You can customize the charts’ appearance and behavior through a flexible set of props.
Setting Up Your Project
1. Install Recharts in Your SPFx Project
First, you need to install Recharts as a dependency in your SPFx project. Navigate to your project directory and run:
npm install recharts
Additionally, if you are using TypeScript, it’s helpful to install the types for Recharts:
npm install --save-dev @types/recharts
2. Building the Line Chart Component with Recharts
Now, let’s create a simple Line Chart component using Recharts. The following example demonstrates how to render a chart within an SPFx web part and load data dynamically from SharePoint lists.

Example: Line Chart with Recharts
In this example, we will render a Line Chart that shows data pulled from a SharePoint list, using Recharts in an SPFx web part.
Step 1: Create the Line Chart Component
Here is how you can create a Line Chart component using Recharts.
import * as React from 'react';
import { LineChart, Line, XAxis, YAxis, CartesianGrid, Tooltip, Legend, ResponsiveContainer } from 'recharts';
interface ILineChartProps {
sp: any; // SharePoint instance passed as props
}
interface ILineChartState {
data: { name: string; uv: number; pv: number; amt: number }[];
}
export default class LineChartComponent extends React.Component<ILineChartProps, ILineChartState> {
constructor(props: ILineChartProps) {
super(props);
this.state = { data: [] };
}
public componentDidMount(): void {
this._fetchChartData();
}
private async _fetchChartData(): Promise<void> {
try {
const items: any[] = await this.props.sp.web.lists.getByTitle('SalesData').items.select('Title', 'Sales', 'Value')();
const chartData = items.map(item => ({
name: item.Title,
uv: item.Sales,
pv: item.Value,
amt: item.Value,
}));
this.setState({ data: chartData });
} catch (error) {
console.error("Error fetching SharePoint list data: ", error);
}
}
public render(): React.ReactElement<ILineChartProps> {
return (
<ResponsiveContainer width="100%" height={400}>
<LineChart
data={this.state.data}
margin={{ top: 5, right: 30, left: 20, bottom: 5 }}
>
<CartesianGrid strokeDasharray="3 3" />
<XAxis dataKey="name" />
<YAxis />
<Tooltip />
<Legend />
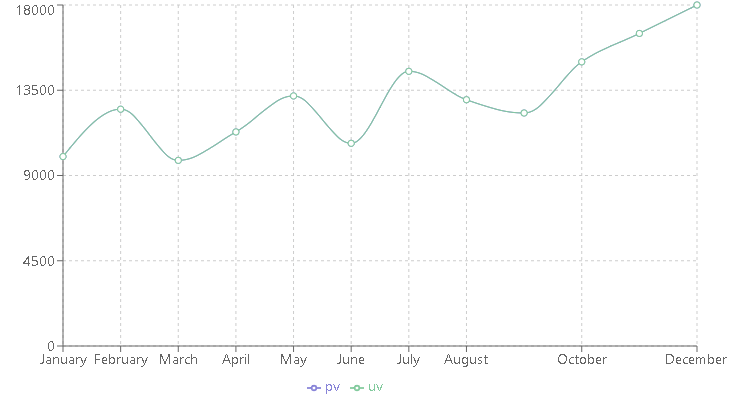
<Line type="monotone" dataKey="pv" stroke="#8884d8" activeDot={{ r: 8 }} />
<Line type="monotone" dataKey="uv" stroke="#82ca9d" />
</LineChart>
</ResponsiveContainer>
);
}
}
Step 2: Pass sp (SharePoint) as Props
In the main web part file, pass the SharePoint context as a prop to the LineChartComponent:
import { sp } from '@pnp/sp';
import * as React from 'react';
import * as ReactDom from 'react-dom';
import { Version } from '@microsoft/sp-core-library';
import { IPropertyPaneConfiguration } from '@microsoft/sp-property-pane';
import { BaseClientSideWebPart } from '@microsoft/sp-webpart-base';

import LineChartComponent from './components/LineChartComponent';

export default class MyLineChartWebPart extends BaseClientSideWebPart<{}> {
  public render(): void {
    const element: React.ReactElement = React.createElement(LineChartComponent, {
      sp: sp, // Pass the SharePoint instance
    });

    ReactDom.render(element, this.domElement);
  }

  protected onInit(): Promise<void> {
    return super.onInit().then(_ => {
      sp.setup(this.context); // Setup PnP SP context
    });
  }
}
Explanation of the Code
- Fetching Data from SharePoint: The
LineChartComponentuses thespprop to retrieve data from a SharePoint list calledSalesData. This list contains three columns:Title,Sales, andValue. - Line Chart Configuration: The chart is rendered using the
LineChartcomponent from Recharts. Two lines represent different data fields (pvanduv). - Responsive Design: The
ResponsiveContainerautomatically adjusts the chart size based on the container’s width and height.
Installing Dependencies
You will need to install the required packages for working with Recharts and TypeScript types:
npm install recharts
npm install --save-dev @types/recharts
Conclusion
Using Recharts with SPFx allows you to easily integrate dynamic, interactive charts into SharePoint web parts. The library provides a rich set of tools for creating various types of charts and is highly customizable, making it a great option for building data-driven interfaces.
In this article, we demonstrated how to set up Recharts in an SPFx project, fetch data from a SharePoint list using PnPJS, and render a responsive Line Chart. You can extend this example to other chart types and use cases, depending on your requirements.

Leave a comment