
All codes and Graphs
Using Chart.js in a SharePoint Framework (SPFx) Web Part with PnPjs
Introduction
In this tutorial, we’ll demonstrate how to integrate Chart.js into a SharePoint Framework (SPFx) web part using PnPjs to fetch data from SharePoint lists. Chart.js is a popular JavaScript library for creating beautiful and interactive charts, and we’ll show how to use it for various chart types: Line, Bar, Pie, Doughnut, and more.
Prerequisites
Before we begin, ensure you have the following:
- SPFx development environment set up.
- PnPjs library installed and configured for your SPFx project.
- A basic understanding of React.
- A SharePoint list containing some data to visualize (e.g., a list with fields such as
TitleandSalesAmount).
Step 1: Set Up PnPjs in SPFx
First, configure PnPjs to work in your SPFx solution. In this article, we assume that the sp object is passed as a prop into the React components. Here’s how you should typically set it up in your SPFx web part (this part you will configure yourself as per your specific project needs).
Step 2: Install Chart.js
Next, install Chart.js into your SPFx solution. In the command line, run the following:
npm install chart.js react-chartjs-2
This will install the necessary libraries for using Chart.js in React.
Step 3: Creating a Line Chart from SharePoint List Data
Here’s an example of a Line Chart that fetches data from a SharePoint list and displays it.
import * as React from 'react';
import { Line } from 'react-chartjs-2';
import {
  Chart as ChartJS,
  CategoryScale,
  LinearScale,
  PointElement,
  LineElement,
  Title,
  Tooltip,
  Legend,
  ChartOptions
} from 'chart.js';

ChartJS.register(CategoryScale, LinearScale, PointElement, LineElement, Title, Tooltip, Legend);

interface ITesteReactChartJsLineChartSPFxProps {
  sp: any;
}

interface ITesteReactChartJsLineChartSPFxState {
  labels: string[];
  salesData: number[];
}

export default class TesteReactChartJsLineChartSPFx extends React.Component<ITesteReactChartJsLineChartSPFxProps, ITesteReactChartJsLineChartSPFxState> {
  constructor(props: ITesteReactChartJsLineChartSPFxProps) {
    super(props);
    this.state = {
      labels: [],
      salesData: []
    };
  }

  public componentDidMount(): void {
    this._getSalesData();
  }

  private async _getSalesData(): Promise<void> {
    try {
      const items: any[] = await this.props.sp.web.lists.getByTitle('sales').items.select('Title', 'SalesAmount')();
      const labels = items.map(item => item.Title);
      const salesData = items.map(item => item.SalesAmount);

      this.setState({
        labels,
        salesData
      });
    } catch (error) {
      console.error("Error fetching data from list: ", error);
    }
  }

  public render(): React.ReactElement<ITesteReactChartJsLineChartSPFxProps> {
    const { labels, salesData } = this.state;

    const data = {
      labels: labels,
      datasets: [
        {
          label: 'Sales',
          data: salesData,
          fill: false,
          borderColor: 'rgb(75, 192, 192)',
          tension: 0.1
        }
      ]
    };

    const options: ChartOptions<'line'> = {
      responsive: true,
      plugins: {
        legend: {
          position: 'top',
        },
        title: {
          display: true,
          text: 'Sales Over Time'
        }
      }
    };

    return (
      <div>
        <h2>Line Chart from SharePoint List</h2>
        <Line data={data} options={options} />
      </div>
    );
  }
}
Explanation
- PnPjs is used to fetch data from a SharePoint list named
sales. - The chart is dynamically updated with the
Titlefield used for the x-axis labels andSalesAmountfor the y-axis values.
Step 4: Creating Other Chart Types
Once the Line Chart works, you can easily adjust it to other chart types by changing the chart component (e.g., Bar, Pie, Doughnut) and registering the appropriate Chart.js modules. Below are examples of other charts.
Doughnut Chart Example
import * as React from 'react';
import { Doughnut } from 'react-chartjs-2';
import { Chart as ChartJS, ArcElement, Tooltip, Legend, ChartOptions } from 'chart.js';

ChartJS.register(ArcElement, Tooltip, Legend);

interface ITesteReactChartJsDoughnutChartSPFxProps {
  sp: any;
}

interface ITesteReactChartJsDoughnutChartSPFxState {
  labels: string[];
  salesData: number[];
}

export default class TesteReactChartJsDoughnutChartSPFx extends React.Component<ITesteReactChartJsDoughnutChartSPFxProps, ITesteReactChartJsDoughnutChartSPFxState> {
  constructor(props: ITesteReactChartJsDoughnutChartSPFxProps) {
    super(props);
    this.state = {
      labels: [],
      salesData: []
    };
  }

  public componentDidMount(): void {
    this._getSalesData();
  }

  private async _getSalesData(): Promise<void> {
    try {
      const items: any[] = await this.props.sp.web.lists.getByTitle('sales').items.select('Title', 'SalesAmount')();
      const labels = items.map(item => item.Title);
      const salesData = items.map(item => item.SalesAmount);

      this.setState({
        labels,
        salesData
      });
    } catch (error) {
      console.error("Error fetching data from list: ", error);
    }
  }

  public render(): React.ReactElement<ITesteReactChartJsDoughnutChartSPFxProps> {
    const { labels, salesData } = this.state;

    const data = {
      labels: labels,
      datasets: [
        {
          label: 'Sales',
          data: salesData,
          backgroundColor: [
            'rgba(255, 99, 132, 0.2)',
            'rgba(54, 162, 235, 0.2)',
            'rgba(255, 206, 86, 0.2)',
            'rgba(75, 192, 192, 0.2)',
            'rgba(153, 102, 255, 0.2)',
            'rgba(255, 159, 64, 0.2)',
          ],
          borderColor: [
            'rgba(255, 99, 132, 1)',
            'rgba(54, 162, 235, 1)',
            'rgba(255, 206, 86, 1)',
            'rgba(75, 192, 192, 1)',
            'rgba(153, 102, 255, 1)',
            'rgba(255, 159, 64, 1)',
          ],
          borderWidth: 1
        }
      ]
    };

    const options: ChartOptions<'doughnut'> = {
      responsive: true,
      plugins: {
        legend: {
          position: 'top',
        },
        title: {
          display: true,
          text: 'Doughnut Chart Example'
        }
      }
    };

    return (
      <div>
        <h2>Doughnut Chart from SharePoint List</h2>
        <Doughnut data={data} options={options} />
      </div>
    );
  }
}
Conclusion
With PnPjs and Chart.js, you can create a wide variety of charts inside SharePoint using SPFx web parts. Whether you need Line, Doughnut, or any other chart type, you can easily integrate Chart.js and dynamically fetch data from your SharePoint lists.
Feel free to extend these examples to other types of charts such as Bar, Pie, or Scatter by following the same principles.
Here are the complete examples for different types of charts using the same model you provided, where the data is fetched from a SharePoint list. All charts use the Title field for the labels and the SalesAmount field for the data.

1. Gráfico de Linha (Line Chart)
import * as React from 'react';
import { Line } from 'react-chartjs-2';
import { Chart as ChartJS, CategoryScale, LinearScale, PointElement, LineElement, Title, Tooltip, Legend, ChartOptions } from 'chart.js';

ChartJS.register(CategoryScale, LinearScale, PointElement, LineElement, Title, Tooltip, Legend);

interface ITesteReactChartJsLineChartSPFxProps {
  sp: any;
}

interface ITesteReactChartJsLineChartSPFxState {
  labels: string[];
  salesData: number[];
}

export default class TesteReactChartJsLineChartSPFx extends React.Component<ITesteReactChartJsLineChartSPFxProps, ITesteReactChartJsLineChartSPFxState> {
  constructor(props: ITesteReactChartJsLineChartSPFxProps) {
    super(props);
    this.state = { labels: [], salesData: [] };
  }

  public componentDidMount(): void {
    this._getSalesData();
  }

  private async _getSalesData(): Promise<void> {
    try {
      const items: any[] = await this.props.sp.web.lists.getByTitle('sales').items.select('Title', 'SalesAmount')();
      const labels = items.map(item => item.Title);
      const salesData = items.map(item => item.SalesAmount);
      this.setState({ labels, salesData });
    } catch (error) {
      console.error("Erro ao buscar dados da lista: ", error);
    }
  }

  public render(): React.ReactElement<ITesteReactChartJsLineChartSPFxProps> {
    const { labels, salesData } = this.state;
    const data = { labels: labels, datasets: [{ label: 'Sales', data: salesData, fill: false, borderColor: 'rgb(75, 192, 192)', tension: 0.1 }] };
    const options: ChartOptions<'line'> = { responsive: true, plugins: { legend: { position: 'top' }, title: { display: true, text: 'Sales Over Time' } } };
    return (<div><h2>Line Chart from SharePoint List</h2><Line data={data} options={options} /></div>);
  }
}
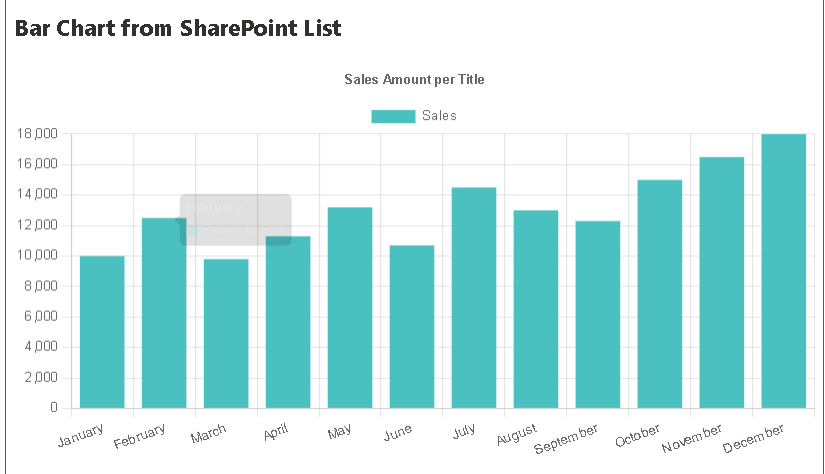
2. Gráfico de Barra (Bar Chart)
import * as React from 'react';
import { Bar } from 'react-chartjs-2';
import { Chart as ChartJS, CategoryScale, LinearScale, BarElement, Title, Tooltip, Legend, ChartOptions } from 'chart.js';

ChartJS.register(CategoryScale, LinearScale, BarElement, Title, Tooltip, Legend);

interface ITesteReactChartJsBarChartSPFxProps {
  sp: any;
}

interface ITesteReactChartJsBarChartSPFxState {
  labels: string[];
  salesData: number[];
}

export default class TesteReactChartJsBarChartSPFx extends React.Component<ITesteReactChartJsBarChartSPFxProps, ITesteReactChartJsBarChartSPFxState> {
  constructor(props: ITesteReactChartJsBarChartSPFxProps) {
    super(props);
    this.state = { labels: [], salesData: [] };
  }

  public componentDidMount(): void {
    this._getSalesData();
  }

  private async _getSalesData(): Promise<void> {
    try {
      const items: any[] = await this.props.sp.web.lists.getByTitle('sales').items.select('Title', 'SalesAmount')();
      const labels = items.map(item => item.Title);
      const salesData = items.map(item => item.SalesAmount);
      this.setState({ labels, salesData });
    } catch (error) {
      console.error("Erro ao buscar dados da lista: ", error);
    }
  }

  public render(): React.ReactElement<ITesteReactChartJsBarChartSPFxProps> {
    const { labels, salesData } = this.state;
    const data = { labels: labels, datasets: [{ label: 'Sales', data: salesData, backgroundColor: 'rgb(75, 192, 192)' }] };
    const options: ChartOptions<'bar'> = { responsive: true, plugins: { legend: { position: 'top' }, title: { display: true, text: 'Sales Amount per Title' } } };
    return (<div><h2>Bar Chart from SharePoint List</h2><Bar data={data} options={options} /></div>);
  }
}

3. Gráfico de Pizza (Pie Chart)
import * as React from 'react';
import { Pie } from 'react-chartjs-2';
import { Chart as ChartJS, ArcElement, Tooltip, Legend, ChartOptions } from 'chart.js';

ChartJS.register(ArcElement, Tooltip, Legend);

interface ITesteReactChartJsPieChartSPFxProps {
  sp: any;
}

interface ITesteReactChartJsPieChartSPFxState {
  labels: string[];
  salesData: number[];
}

export default class TesteReactChartJsPieChartSPFx extends React.Component<ITesteReactChartJsPieChartSPFxProps, ITesteReactChartJsPieChartSPFxState> {
  constructor(props: ITesteReactChartJsPieChartSPFxProps) {
    super(props);
    this.state = { labels: [], salesData: [] };
  }

  public componentDidMount(): void {
    this._getSalesData();
  }

  private async _getSalesData(): Promise<void> {
    try {
      const items: any[] = await this.props.sp.web.lists.getByTitle('sales').items.select('Title', 'SalesAmount')();
      const labels = items.map(item => item.Title);
      const salesData = items.map(item => item.SalesAmount);
      this.setState({ labels, salesData });
    } catch (error) {
      console.error("Erro ao buscar dados da lista: ", error);
    }
  }

  public render(): React.ReactElement<ITesteReactChartJsPieChartSPFxProps> {
    const { labels, salesData } = this.state;
    const data = { labels: labels, datasets: [{ label: 'Sales', data: salesData, backgroundColor: ['rgb(255, 99, 132)', 'rgb(54, 162, 235)', 'rgb(255, 206, 86)'] }] };
    const options: ChartOptions<'pie'> = { responsive: true, plugins: { legend: { position: 'top' }, title: { display: true, text: 'Sales Distribution' } } };
    return (<div><h2>Pie Chart from SharePoint List</h2><Pie data={data} options={options} /></div>);
  }
}
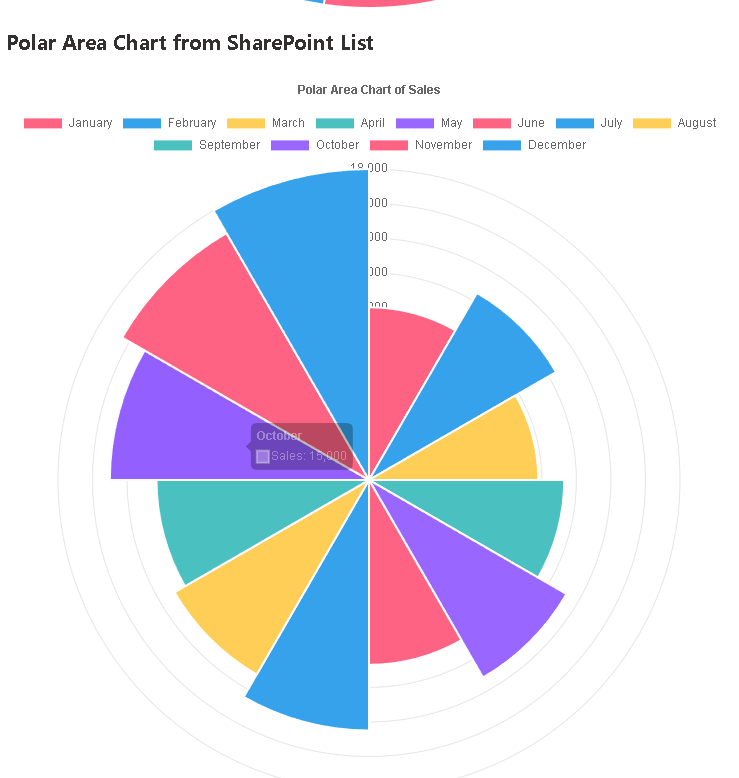
4. Gráfico Polar (PolarArea Chart)
import * as React from 'react';
import { PolarArea } from 'react-chartjs-2';
import { Chart as ChartJS, RadialLinearScale, ArcElement, Tooltip, Legend, ChartOptions } from 'chart.js';

ChartJS.register(RadialLinearScale, ArcElement, Tooltip, Legend);

interface ITesteReactChartJsPolarAreaChartSPFxProps {
  sp: any;
}

interface ITesteReactChartJsPolarAreaChartSPFxState {
  labels: string[];
  salesData: number[];
}

export default class TesteReactChartJsPolarAreaChartSPFx extends React.Component<ITesteReactChartJsPolarAreaChartSPFxProps, ITesteReactChartJsPolarAreaChartSPFxState> {
  constructor(props: ITesteReactChartJsPolarAreaChartSPFxProps) {
    super(props);
    this.state = { labels: [], salesData: [] };
  }

  public componentDidMount(): void {
    this._getSalesData();
  }

  private async _getSalesData(): Promise<void> {
    try {
      const items: any[] = await this.props.sp.web.lists.getByTitle('sales').items.select('Title', 'SalesAmount')();
      const labels = items.map(item => item.Title);
      const salesData = items.map(item => item.SalesAmount);
      this.setState({ labels, salesData });
    } catch (error) {
      console.error("Erro ao buscar dados da lista: ", error);
    }
  }

  public render(): React.ReactElement<ITesteReactChartJsPolarAreaChartSPFxProps> {
    const { labels, salesData } = this.state;
    const data = { labels: labels, datasets: [{ label: 'Sales', data: salesData, backgroundColor: ['rgb(255, 99, 132)', 'rgb(54, 162, 235)', 'rgb(255, 206, 86)', 'rgb(75, 192, 192)', 'rgb(153, 102, 255)'] }] };
    const options: ChartOptions<'polarArea'> = { responsive: true, plugins: { legend: { position: 'top' }, title: { display: true, text: 'Polar Area Chart of Sales' } } };
    return (<div><h2>Polar Area Chart from SharePoint List</h2><PolarArea data={data} options={options} /></div>);
  }
}

5. Gráfico de Radar (Radar Chart)
import * as React from 'react';
import { Radar } from 'react-chartjs-2';
import { Chart as ChartJS, RadialLinearScale, PointElement, LineElement, Tooltip, Legend, ChartOptions } from 'chart.js';

ChartJS.register(RadialLinearScale, PointElement, LineElement, Tooltip, Legend);

interface ITesteReactChartJsRadarChartSPFxProps {
  sp: any;
}

interface ITesteReactChartJsRadarChartSPFxState {
  labels: string[];
  salesData: number[];
}

export default class TesteReactChartJsRadarChartSPFx extends React.Component<ITesteReactChartJsRadarChartSPFxProps, ITesteReactChartJsRadarChartSPFxState> {
  constructor(props: ITesteReactChartJsRadarChartSPFxProps) {
    super(props);
    this.state = { labels: [], salesData: [] };
  }

  public componentDidMount(): void {
    this._getSalesData();
  }

  private async _getSalesData(): Promise<void> {
    try {
      const items: any[] = await this.props.sp.web.lists.getByTitle('sales').items.select('Title', 'SalesAmount')();
      const labels = items.map(item => item.Title);
      const salesData = items.map(item => item.SalesAmount);
      this.setState({ labels, salesData });
    } catch (error) {
      console.error("Erro ao buscar dados da lista: ", error);
    }
  }

  public render(): React.ReactElement<ITesteReactChartJsRadarChartSPFxProps> {
    const { labels, salesData } = this.state;
    const data = { labels: labels, datasets: [{ label: 'Sales', data: salesData, backgroundColor: 'rgba(75, 192, 192, 0.2)', borderColor: 'rgb(75, 192, 192)', pointBackgroundColor: 'rgb(75, 192, 192)' }] };
    const options: ChartOptions<'radar'> = { responsive: true, plugins: { legend: { position: 'top' }, title: { display: true, text: 'Radar Chart of Sales' } } };
    return (<div><h2>Radar Chart from SharePoint List</h2><Radar data={data} options={options} /></div>);
  }
}

Leave a comment