
Here’s an article structure with two sections: one focusing on creating a SharePoint Framework (SPFx) chart with React and Recharts, and the other demonstrating how to visualize World Bank data using Python and Matplotlib.
Visualizing World Bank Data: SPFx with React and Python with Matplotlib
Section 1: Creating a Chart with SPFx and React
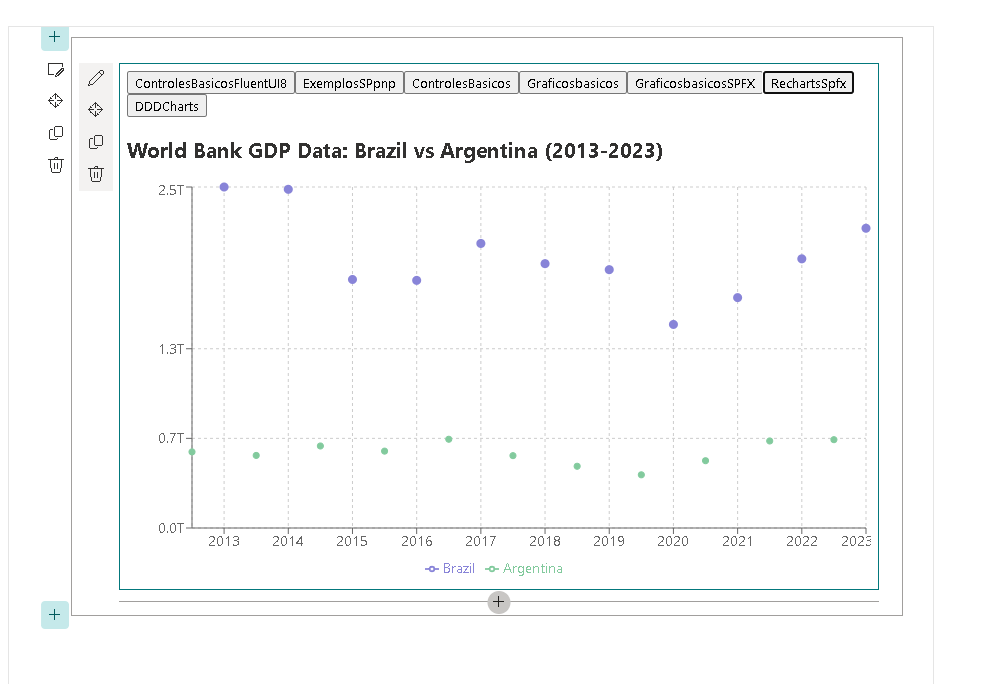
In this section, we will create a dynamic chart using the SharePoint Framework (SPFx) with React and the Recharts library to visualize GDP data from the World Bank for Brazil and Argentina from 2013 to 2023.
Setting Up Your SPFx Environment
Before starting, ensure you have the following installed:
- Node.js
- Yeoman
- SharePoint Framework Yeoman generator
To create your SPFx project, run the following command in your terminal:
yo @microsoft/sharepoint
Follow the prompts to set up your project. Choose “React” as the framework.
Installing Recharts
To install the Recharts library, navigate to your project directory and run:
npm install recharts
Implementing the World Bank Chart
Here’s the complete WorldBankChart.tsx code that fetches data from the World Bank API and visualizes it using a line chart:
import * as React from 'react';
import {
  LineChart,
  Line,
  XAxis,
  YAxis,
  CartesianGrid,
  Tooltip,
  Legend,
  ResponsiveContainer
} from 'recharts';

// Defining the structure of the API data
interface IWorldBankItem {
  country: {
    id: string;
  };
  date: number;
  value: number | null;
}

export interface IWorldBankData {
  year: number;
  Brazil: number | null;
  Argentina: number | null;
}

const WorldBankChart: React.FC = () => {
  const [data, setData] = React.useState<IWorldBankData[]>([]);
  const [loading, setLoading] = React.useState<boolean>(true); // State to manage loading

  React.useEffect(() => {
    const fetchData = async () => {
      const apiUrl = 'https://api.worldbank.org/v2/country/BR;AR/indicator/NY.GDP.MKTP.CD?date=2013:2023&format=json';

      try {
        const response = await fetch(apiUrl);
        const result = await response.json();
        const formattedData = formatData(result);
        setData(formattedData);
      } catch (error) {
        console.error('Error fetching data: ', error);
      } finally {
        setLoading(false); // Set loading to false after fetching
      }
    };

    fetchData();
  }, []);

  const formatData = (data: any[]): IWorldBankData[] => {
    const mappedData = data[1].map((item: IWorldBankItem) => ({
      year: item.date,
      Brazil: item.country.id === 'BR' ? item.value : null,
      Argentina: item.country.id === 'AR' ? item.value : null,
    }));

    // Sorting the data from oldest to most recent
    return mappedData.sort((a: IWorldBankData, b: IWorldBankData) => a.year - b.year);
  };

  const formatTooltipValue = (value: number | null | undefined) => {
    if (typeof value === 'number') {
      return new Intl.NumberFormat('en-US', { style: 'currency', currency: 'USD' }).format(value);
    }
    return '-'; // Return a dash if the value is not a number
  };

  const tooltipFormatter = (value: number | string | null | undefined, name: string) => {
    return [formatTooltipValue(value as number), name]; // Ensure value is a number
  };

  return (
    <div className="chart-container">
      <h2>World Bank GDP Data: Brazil vs Argentina (2013-2023)</h2> {/* Chart Title */}
      {loading ? ( // Show loading spinner or message
        <div className="loading">Loading...</div>
      ) : (
        <ResponsiveContainer width="100%" height={400}>
          <LineChart data={data}>
            <CartesianGrid strokeDasharray="3 3" />
            <XAxis dataKey="year" />
            <YAxis
              domain={[0, 'dataMax']}
              tickFormatter={(value) => `${(value / 1e12).toFixed(1)}T`} // Format Y-axis in trillions
            />
            <Tooltip formatter={tooltipFormatter as any} />
            <Legend />
            <Line type="monotone" dataKey="Brazil" stroke="#8884d8" dot={{ fill: '#8884d8' }} activeDot={{ r: 8 }} strokeWidth={3} />
            <Line type="monotone" dataKey="Argentina" stroke="#82ca9d" dot={{ fill: '#82ca9d' }} activeDot={{ r: 8 }} />
          </LineChart>
        </ResponsiveContainer>
      )}
    </div>
  );
};

export default WorldBankChart;
Explanation of the Code
- Fetching Data: The component fetches GDP data for Brazil and Argentina from the World Bank API using the
fetchmethod withinuseEffect. - Formatting Data: The fetched data is formatted into a usable structure for Recharts.
- Rendering the Chart: The chart is rendered with lines representing each country’s GDP, and the Y-axis is formatted to display values in trillions.
Section 2: Visualizing World Bank Data with Python and Matplotlib
In this section, we will visualize the same World Bank GDP data using Python and Matplotlib.
Setting Up Your Python Environment
Before we begin, ensure you have the following libraries installed:
pip install matplotlib requests
Fetching and Plotting the Data
Here’s a complete Python script that fetches the World Bank GDP data and plots it using Matplotlib:
import requests
import matplotlib.pyplot as plt

# Define the API URL
api_url = 'https://api.worldbank.org/v2/country/BR;AR/indicator/NY.GDP.MKTP.CD?date=2013:2023&format=json'

# Fetch the data
response = requests.get(api_url)
data = response.json()

# Parse the data
years = []
brazil_gdp = []
argentina_gdp = []

for item in data[1]:
    year = item['date']
    value = item['value']
    if item['country']['id'] == 'BR':
        years.append(year)
        brazil_gdp.append(value)
    elif item['country']['id'] == 'AR':
        argentina_gdp.append(value)

# Convert GDP to trillions for plotting
brazil_gdp_trillions = [gdp / 1e12 for gdp in brazil_gdp]
argentina_gdp_trillions = [gdp / 1e12 for gdp in argentina_gdp]

# Create the plot
plt.figure(figsize=(10, 5))
plt.plot(years, brazil_gdp_trillions, marker='o', label='Brazil', color='blue')
plt.plot(years, argentina_gdp_trillions, marker='o', label='Argentina', color='green')
plt.title('World Bank GDP Data: Brazil vs Argentina (2013-2023)')
plt.xlabel('Year')
plt.ylabel('GDP in Trillions of USD')
plt.xticks(years)  # Ensure all years are shown on the x-axis
plt.grid()
plt.legend()
plt.tight_layout()

# Show the plot
plt.show()
Explanation of the Code
- Fetching Data: The script uses the
requestslibrary to fetch GDP data from the World Bank API. - Parsing Data: The JSON response is parsed to extract the years and GDP values for both Brazil and Argentina.
- Plotting: Matplotlib is used to create a line plot that visualizes GDP in trillions of dollars.
Conclusion
In this article, we demonstrated how to visualize World Bank GDP data using both SPFx with React and Python with Matplotlib. By fetching and rendering data, developers can create powerful visualizations that enhance data understanding and analysis.
Additional API Examples
For further exploration, here are 20 example API calls you can make to the World Bank API to get different indicators:
- GDP Growth (Annual %)
https://api.worldbank.org/v2/country/BR;AR/indicator/NY.GDP.MKTP.CD?date=2013:2023&format=json
- Population, total
https://api.worldbank.org/v2/country/BR;AR/indicator/SP.POP.TOTL?date=2013:2023&format=json
- Unemployment, total (% of total labor force)
https://api.worldbank.org/v2/country/BR;AR/indicator/SL.UEM.TOTL.ZS?date=2013:2023&format=json
- Inflation, consumer prices (annual %)
https://api.worldbank.org/v2/country/BR;AR/indicator/FP.CPI.TOTL.ZG?date=2013:2023&format=json
- Exports of goods and services (% of GDP)
https://api.worldbank.org/v2/country/BR;AR/indicator/NE.EXP.GOVT.ZS?date=2013:2023&format=json
- Imports of goods and services (% of GDP)
- `
- Current account balance (% of GDP)
https://api.worldbank.org/v2/country/BR;AR/indicator/BX.KLT.DINV.CD.WD?date=2013:2023&format=json
- Fertility rate, total (births per woman)
https://api.worldbank.org/v2/country/BR;AR/indicator/SP.DYN.TFRT.IN?date=2013:2023&format=json
- Life expectancy at birth, total (years)
https://api.worldbank.org/v2/country/BR;AR/indicator/SP.DYN.LE00.IN?date=2013:2023&format=json
- Education expenditure, total (% of GDP)
https://api.worldbank.org/v2/country/BR;AR/indicator/SE.XPD.TOTL.GD.ZS?date=2013:2023&format=json
- Access to electricity (% of population)
https://api.worldbank.org/v2/country/BR;AR/indicator/EG.ELC.ACCS.ZS?date=2013:2023&format=json
- Renewable energy consumption (% of total final energy consumption)
https://api.worldbank.org/v2/country/BR;AR/indicator/EG.FEC.RNEW.ZS?date=2013:2023&format=json
- Total greenhouse gas emissions (kt of CO2 equivalent)
https://api.worldbank.org/v2/country/BR;AR/indicator/EN.ATM.CO2E.KT?date=2013:2023&format=json
- Forest area (% of land area)
https://api.worldbank.org/v2/country/BR;AR/indicator/FR.STA.FORE.ZS?date=2013:2023&format=json
- Mobile cellular subscriptions (per 100 people)
https://api.worldbank.org/v2/country/BR;AR/indicator/IT.CEL.SETS.P2?date=2013:2023&format=json
- Internet users (per 100 people)
https://api.worldbank.org/v2/country/BR;AR/indicator/IT.NET.USER.ZS?date=2013:2023&format=json
- GDP per capita (current US$)
https://api.worldbank.org/v2/country/BR;AR/indicator/NY.GDP.PCAP.CD?date=2013:2023&format=json
- Gross national income (GNI) per capita, Atlas method (current US$)
https://api.worldbank.org/v2/country/BR;AR/indicator/NY.GNP.PCAP.CD?date=2013:2023&format=json
- Poverty headcount ratio at $1.90 a day (2011 PPP) (% of population)
https://api.worldbank.org/v2/country/BR;AR/indicator/SI.POV.DDAY?date=2013:2023&format=json
- Access to clean water (% of population with access)
https://api.worldbank.org/v2/country/BR;AR/indicator/SH.H2O.SAFE.ZS?date=2013:2023&format=json
Feel free to modify any parts of the article or ask for additional content!

Leave a comment