Building a Brazil Capitals Weather App in Power Apps: Step-by-Step with Power Automate, Open-Meteo, Current Conditions, and Forecast Charts
This article walks through how to build a phone-layout Canvas App in Power Apps that lets a user select a Brazilian capital, load the current weather, and switch to a forecast charts view powered by Power Automate and Open-Meteo. The app uses a dropdown for capital selection, icon-based actions, a current-weather summary panel, and chart controls for forecast visualization.
The design pattern is simple and very effective:
Power Apps Canvas App
→ calls
Power Automate flow
→ calls
Open-Meteo Forecast API
This is a very solid learning pattern because the app stays focused on the UI, while the flow handles the API request and data shaping. Microsoft documents that Canvas Apps can trigger Power Automate flows from controls such as buttons and icons, and Open-Meteo documents the forecast endpoint and supported weather variables such as temperature, rain, and wind speed.
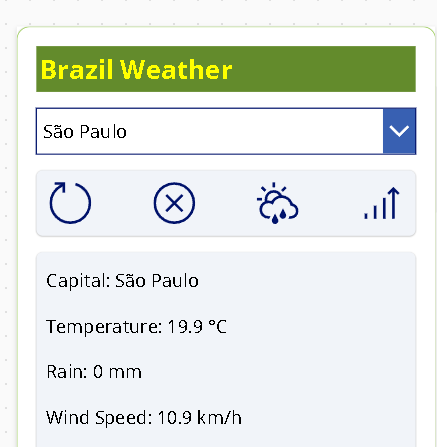
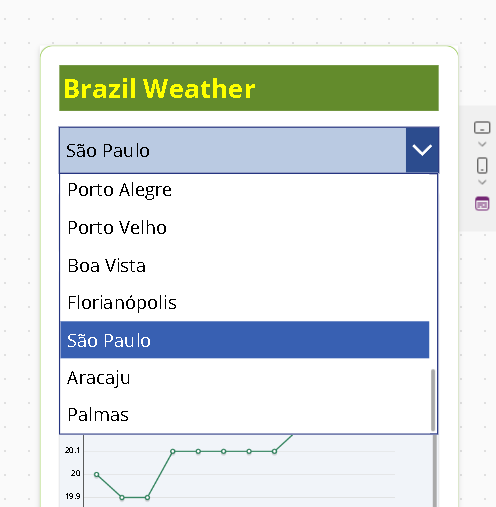
Final app experience
The final mobile app includes:

- a title header
- a dropdown with Brazilian capitals
- icon-based actions for load, reset, current view, and charts view
- a current weather summary panel
- a charts panel with forecast visualization
- switching between current and charts views using a Power Fx variable
This app is intentionally compact and mobile-friendly. Instead of overloading the first screen with tables, cards, and multiple sections at once, the layout stays focused and readable.
1. Solution architecture
The app uses three layers.
Power Apps Canvas App
Responsible for:
- dropdown selection
- icon navigation/actions
- current weather labels
- chart display
- switching between views
Power Automate flow
Responsible for:
- receiving latitude, longitude, and capital name
- calling the weather API
- parsing the JSON response
- shaping the forecast data
- returning a compact payload back to the app
Open-Meteo API
Responsible for:
- current weather data
- hourly forecast data
This separation is important because it keeps the app formulas cleaner and makes the API logic easier to debug and evolve. Microsoft’s guidance for Canvas Apps and Power Automate supports this app-to-flow pattern. Open-Meteo documents the weather forecast endpoint and variable support for current and hourly data.
2. Prerequisites
Before building the app, make sure you have:
- access to Power Apps
- access to Power Automate
- permission to create a Canvas App
- permission to create a cloud flow
- a Power Platform environment where both the app and the flow live
If you use the generic HTTP action in Power Automate, note that the HTTP connector is a premium capability in Power Platform licensing scenarios. That does not stop you from learning the pattern, but it matters in enterprise rollout planning.
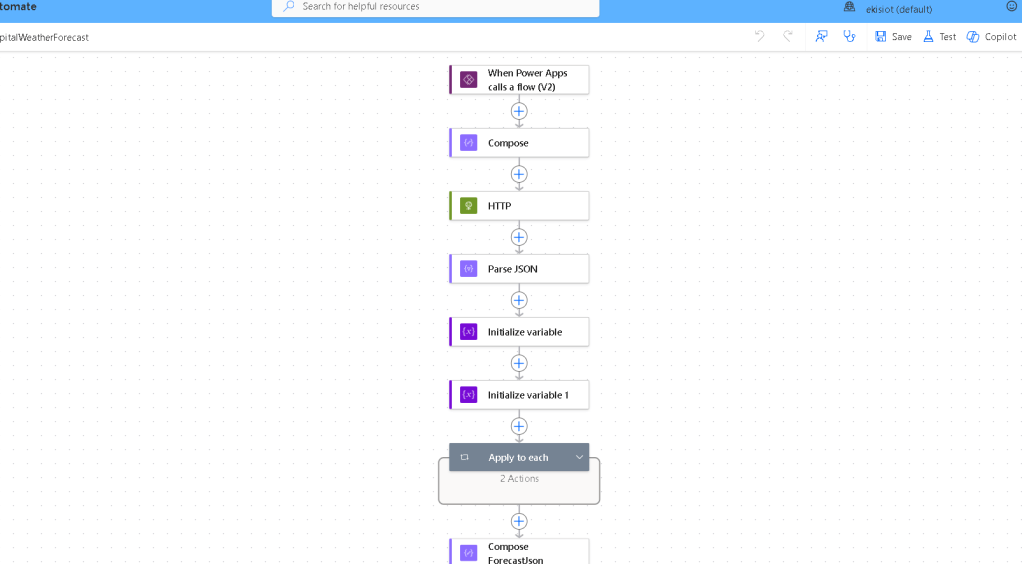
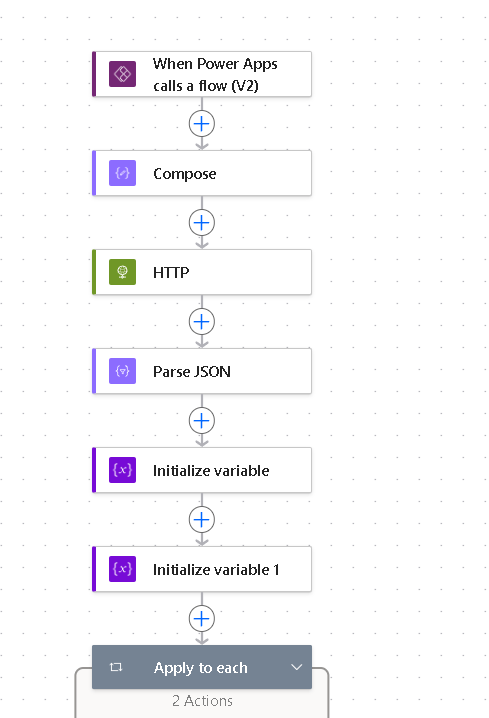
3. Create the Power Automate flow
Create a new Instant cloud flow and use the Power Apps (V2) trigger. This is the right trigger for flows called from a Canvas App. Microsoft documents this trigger pattern for app-driven flow execution.
Trigger inputs
Add three text inputs:
latitudelongitudecapitalName
These values will come from the selected city in the app.
Build the API request
Add a Compose action to build the URL. This makes the flow easier to debug than hardcoding the entire expression directly inside the HTTP action.
Use this expression:
concat( 'https://api.open-meteo.com/v1/forecast?latitude=', triggerBody()['latitude'], '&longitude=', triggerBody()['longitude'], '¤t=temperature_2m,rain,wind_speed_10m', '&hourly=temperature_2m,rain,wind_speed_10m', '&forecast_hours=12', '&timezone=auto')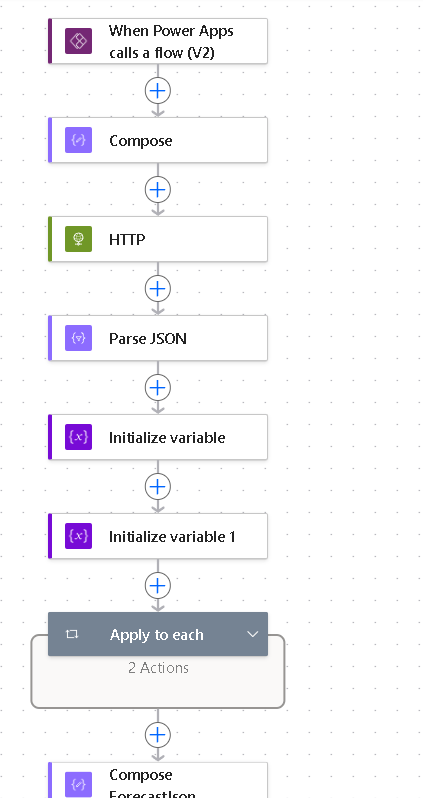
This request asks Open-Meteo for:
- current temperature
- current rain
- current wind speed
- hourly temperature
- hourly rain
- hourly wind speed
- the next 12 forecast hours
- local timezone resolution for the selected coordinates
Open-Meteo documents all of these query capabilities in the forecast API.
Add the HTTP action
Add an HTTP action:
- Method:
GET - URI: output of the Compose action
Add Parse JSON
After the HTTP action, add Parse JSON.
Use the HTTP body as content and a schema shaped like this:
{ "type": "object", "properties": { "timezone": { "type": "string" }, "current": { "type": "object", "properties": { "time": { "type": "string" }, "temperature_2m": { "type": "number" }, "rain": { "type": "number" }, "wind_speed_10m": { "type": "number" } } }, "hourly": { "type": "object", "properties": { "time": { "type": "array", "items": { "type": "string" } }, "temperature_2m": { "type": "array", "items": { "type": "number" } }, "rain": { "type": "array", "items": { "type": "number" } }, "wind_speed_10m": { "type": "array", "items": { "type": "number" } } } } }}Microsoft documents Parse JSON and other data operations as the standard flow tools for reshaping JSON payloads.
Build a forecast array
Because Open-Meteo returns hourly arrays in parallel, shape them into a single array of objects inside the flow. This is easier than making Power Apps zip arrays together itself.
Initialize:
varForecastas an ArrayvarIndexas an Integer starting at 0
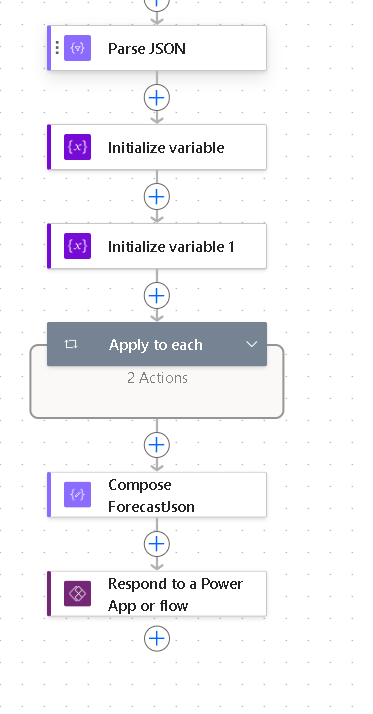
Loop over hourly.time and append objects like this:
{ "time": "@{items('Apply_to_each')}", "temperature": "@{body('Parse_JSON')?['hourly']?['temperature_2m'][variables('varIndex')]}", "rain": "@{body('Parse_JSON')?['hourly']?['rain'][variables('varIndex')]}", "windSpeed": "@{body('Parse_JSON')?['hourly']?['wind_speed_10m'][variables('varIndex')]}"}Then increment varIndex by 1 on each iteration.
This creates forecast rows in a shape that Power Apps can consume much more easily.
Return the result to Power Apps
Finish with Respond to a PowerApp or flow and return:
capitalNamecurrentTemperaturecurrentRaincurrentWindSpeedcurrentTimetimezoneforecastjson
Use string(variables('varForecast')) or a Compose output converted to string for forecastjson.
At this point, the flow is ready.
4. Create the Canvas App
Create a phone layout Canvas App and use Portrait orientation. Microsoft documents portrait configuration in app display settings and recommends responsive formulas and container-based layouts for smaller screens.
The screen layout can be organized like this:
- title
- dropdown
- icon action bar
- current weather container
- chart container
This keeps the mobile experience focused and easy to scan.
5. Add the capitals collection
The app needs a city selector, but Open-Meteo needs coordinates. The simplest solution is to build an in-memory collection of capitals with their coordinates.
In Screen.OnVisible, create colCapitals and initialize the app state.
Use a formula like this:
Set(varViewMode, "Current");Set( varWeather, { capitalName: "", currentTemperature: 0, currentRain: 0, currentWindSpeed: 0, currentTime: "", forecastjson: "" });ClearCollect( colCapitals, { Capital: "Rio Branco", State: "AC", Latitude: -9.97, Longitude: -67.81 }, { Capital: "Maceió", State: "AL", Latitude: -9.67, Longitude: -35.74 }, { Capital: "Macapá", State: "AP", Latitude: 0.03, Longitude: -51.05 }, { Capital: "Manaus", State: "AM", Latitude: -3.10, Longitude: -60.02 }, { Capital: "Salvador", State: "BA", Latitude: -12.97, Longitude: -38.50 }, { Capital: "Fortaleza", State: "CE", Latitude: -3.73, Longitude: -38.54 }, { Capital: "Brasília", State: "DF", Latitude: -15.79, Longitude: -47.88 }, { Capital: "Vitória", State: "ES", Latitude: -20.32, Longitude: -40.34 }, { Capital: "Goiânia", State: "GO", Latitude: -16.68, Longitude: -49.25 }, { Capital: "São Luís", State: "MA", Latitude: -2.53, Longitude: -44.30 }, { Capital: "Cuiabá", State: "MT", Latitude: -15.60, Longitude: -56.10 }, { Capital: "Campo Grande", State: "MS", Latitude: -20.45, Longitude: -54.62 }, { Capital: "Belo Horizonte", State: "MG", Latitude: -19.92, Longitude: -43.94 }, { Capital: "Belém", State: "PA", Latitude: -1.46, Longitude: -48.50 }, { Capital: "João Pessoa", State: "PB", Latitude: -7.12, Longitude: -34.86 }, { Capital: "Curitiba", State: "PR", Latitude: -25.43, Longitude: -49.27 }, { Capital: "Recife", State: "PE", Latitude: -8.05, Longitude: -34.88 }, { Capital: "Teresina", State: "PI", Latitude: -5.09, Longitude: -42.80 }, { Capital: "Rio de Janeiro", State: "RJ", Latitude: -22.91, Longitude: -43.17 }, { Capital: "Natal", State: "RN", Latitude: -5.79, Longitude: -35.21 }, { Capital: "Porto Alegre", State: "RS", Latitude: -30.03, Longitude: -51.23 }, { Capital: "Porto Velho", State: "RO", Latitude: -8.76, Longitude: -63.90 }, { Capital: "Boa Vista", State: "RR", Latitude: 2.82, Longitude: -60.67 }, { Capital: "Florianópolis", State: "SC", Latitude: -27.59, Longitude: -48.55 }, { Capital: "São Paulo", State: "SP", Latitude: -23.55, Longitude: -46.63 }, { Capital: "Aracaju", State: "SE", Latitude: -10.91, Longitude: -37.07 }, { Capital: "Palmas", State: "TO", Latitude: -10.18, Longitude: -48.33 });ClearCollect( colForecast, { TimeText: "", Temperature: 0, Rain: 0, WindSpeed: 0 });Clear(colForecast)This establishes:
varViewModefor switching containersvarWeatherfor current weather datacolCapitalsfor the dropdowncolForecastfor charts and forecast display
Microsoft documents Set, ClearCollect, and collections as standard Power Fx data tools in Canvas Apps.
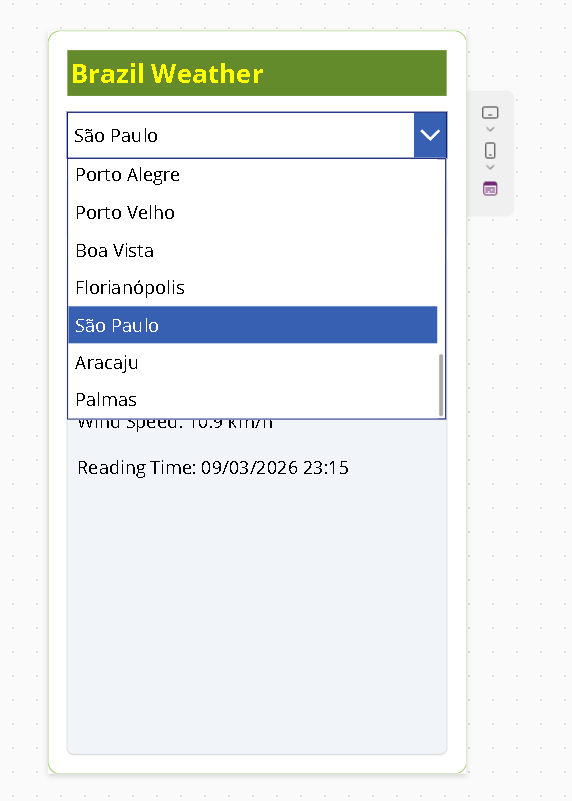
6. Configure the dropdown
Set the dropdown Items property to:
colCapitalsFor a classic dropdown, set the display/value field to:
"Capital"This lets the user choose a city name while the app still has access to the associated latitude and longitude.
7. Load weather from the flow
The main load action does two things:
- call the flow and fill
varWeather - parse the forecast JSON and load
colForecast
Use this on the load icon or load button:
Set( varWeather, GetCapitalWeatherForecast.Run( Text(drpCapital.Selected.Latitude), Text(drpCapital.Selected.Longitude), drpCapital.Selected.Capital ));ClearCollect( colForecast, ForAll( ParseJSON(varWeather.forecastjson) As rec, { TimeText: Text( DateTimeValue(Text(rec.time)), "hh:mm" ), Temperature: Value(rec.temperature), Rain: Value(rec.rain), WindSpeed: Value(rec.windSpeed) } ))This formula is important for two reasons.
First, ParseJSON returns a Dynamic structure, so the forecast rows must be converted into a real collection that Power Apps controls can use. Microsoft documents that ParseJSON returns a Dynamic value and that fields are accessed with dot notation and converted with functions like Text() and Value().
Second, the chart control works much better when it is pointed at a normal collection like colForecast.
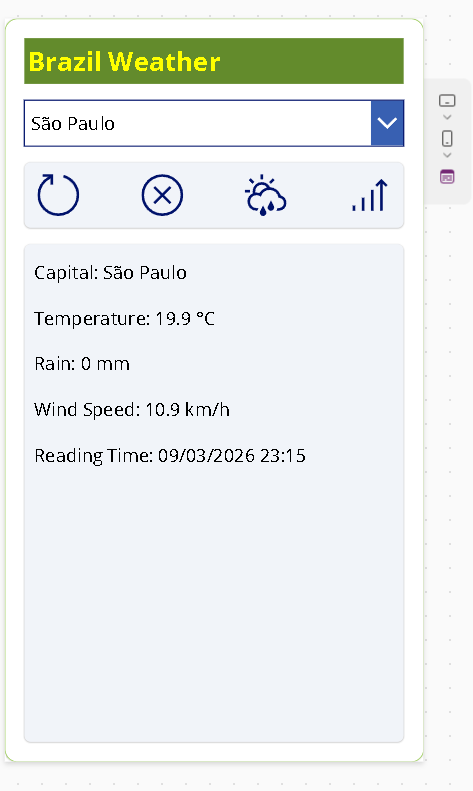
8. Current weather panel
Use varWeather for the summary panel.
Example label formulas:
Capital
If( IsBlank(varWeather.capitalName), "", "Capital: " & varWeather.capitalName)Temperature
If( IsBlank(varWeather.capitalName), "", "Temperature: " & Text(varWeather.currentTemperature) & " °C")Rain
If( IsBlank(varWeather.capitalName), "", "Rain: " & Text(varWeather.currentRain) & " mm")Wind speed
If( IsBlank(varWeather.capitalName), "", "Wind Speed: " & Text(varWeather.currentWindSpeed) & " km/h")Reading time
If( IsBlank(varWeather.capitalName), "", "Reading Time: " & Text( DateTimeValue(varWeather.currentTime), "dd/mm/yyyy hh:mm" ))Microsoft documents DateTimeValue, Text, and IsBlank for formatting and conditional rendering in Power Fx.
9. Replace text buttons with icons
For the final UI, replacing text buttons with icons is a great move for a phone layout. Power Apps supports classic Icon controls with OnSelect and AccessibleLabel, as well as modern button icon layouts.
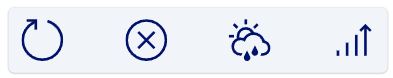
Recommended icon mapping:
- Load → reload/sync icon
- Reset → cancel/close/reset icon
- Current → weather/current info icon
- Charts → line chart icon
The final screen used a compact icon bar, which fits much better in mobile width than four full buttons.
10. Switch between Current and Charts views
Do not try to write directly to a container’s Visible property from OnSelect. In Canvas Apps, the correct pattern is:
- change a variable on click
- let each container’s
Visibleformula react to that variable
Set the icons like this:
Current icon OnSelect
Set(varViewMode, "Current")Charts icon OnSelect
Set(varViewMode, "Charts")Then set container visibility:
Current container Visible
varViewMode = "Current"Chart container Visible
varViewMode = "Charts"This is the correct Power Fx interaction model for view switching. Microsoft documents button/icon action formulas with OnSelect, the Set function for variables, and Visible as a formula-based control property.
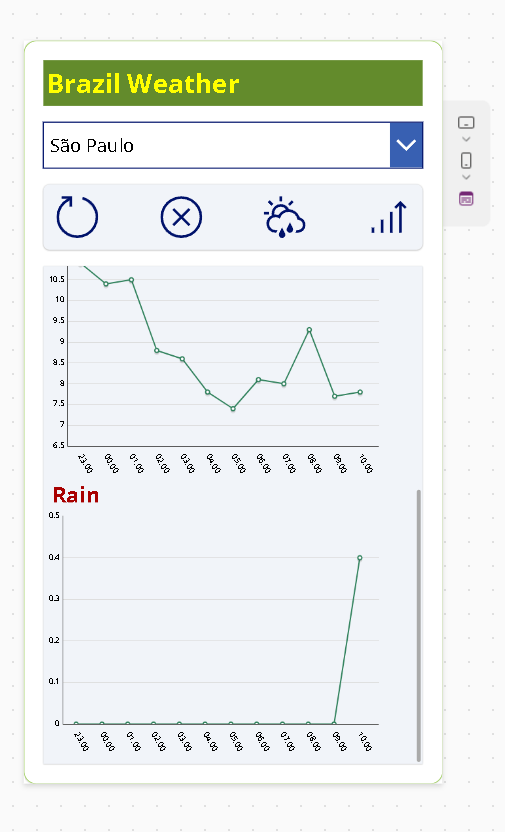
11. Configure the charts
For forecast visualization, a Line chart is the best fit because the forecast is time-based. Power Apps chart controls expect the leftmost column to be the label axis and the remaining columns to be numeric series. Microsoft documents that line and column charts use an Items source with labels in the first column and one or more value series after that.
Because colForecast already contains:
TimeTextTemperatureRainWindSpeed
you can feed charts directly from it.
Temperature chart Items
ShowColumns(colForecast, "TimeText", "Temperature")Wind chart Items
ShowColumns(colForecast, "TimeText", "WindSpeed")Rain chart Items
ShowColumns(colForecast, "TimeText", "Rain")For chart titles, either update the child title label inside the chart group or place your own label above the chart.
Example title formulas:
"Temperature Forecast - " & varWeather.capitalName"Wind Speed Forecast - " & varWeather.capitalName"Rain Forecast - " & varWeather.capitalName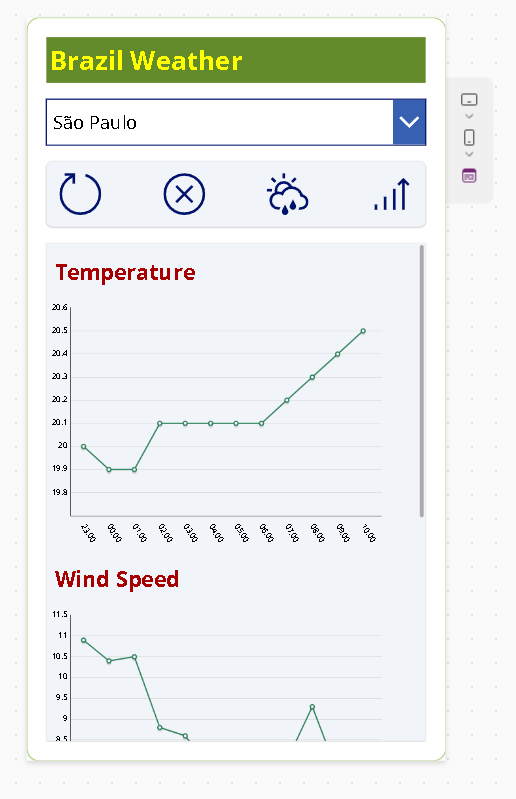
12. Reset behavior
Use the reset icon to restore the app state:
Set( varWeather, { capitalName: "", currentTemperature: 0, currentRain: 0, currentWindSpeed: 0, currentTime: "", forecastjson: "" });Clear(colForecast);Reset(drpCapital);Set(varViewMode, "Current")This clears:
- current weather labels
- forecast collection
- dropdown selection
- view mode
It returns the app to a clean default state.
13. Final layout observations
The final design works well because it keeps the app small and readable:
- one city selector
- one action toolbar
- one summary view
- one charts view
The app does not try to show everything at once. That is especially important on a phone layout.
The charts view became much more useful than a forecast gallery in this version because:
- it is easier to scan trends
- it uses screen space better
- it makes wind and rain patterns visible quickly
This is a great example of letting the UI evolve after the data flow is already working.
14. Troubleshooting notes
ParseJSON returns blank
This usually means:
- the source property is blank
- the flow field name is wrong
- the parsed dynamic fields are being accessed incorrectly
The correct array iteration pattern in this app was:
ForAll(ParseJSON(varWeather.forecastjson) As rec, ...)not a mixed ThisRecord.Value.* pattern from a different JSON/table scenario. Microsoft documents ForAll, ParseJSON, and Dynamic value handling in Power Fx.
Gallery or chart stays empty
This usually means colForecast was never filled. Add a temporary debug label:
CountRows(colForecast)If it returns 0 after loading, the problem is in the flow output or parsing step.,,
Container switching does not work
This usually means Visible is being assigned directly in OnSelect, which is not the right pattern. Use Set(varViewMode, ...) and formula-driven Visible.
Final thoughts
This app is a strong example of building a useful Power Apps mobile experience incrementally:
- start with a fixed city
- move to a capital selector
- integrate a flow
- parse JSON
- load a collection
- show current weather
- evolve the forecast display into charts
- replace bulky buttons with icons
The result is not just functional. It is also a practical pattern you can reuse in many other Power Platform projects that combine a Canvas App, a flow, and a public API.
Summary Table
| Step | What you build | Key result |
|---|---|---|
| 1 | Power Automate flow | API integration and JSON shaping |
| 2 | Capitals collection | Dropdown with city + coordinates |
| 3 | Weather load logic | varWeather + colForecast filled from flow |
| 4 | Current weather panel | Summary view for selected capital |
| 5 | Icon toolbar | Cleaner mobile actions |
| 6 | View mode variable | Current/charts switching |
| 7 | Chart controls | Forecast visualization by hour |
| 8 | Reset logic | Clean app state restoration |
Technical Table
| Element | Formula / Pattern |
|---|---|
| Flow call | GetCapitalWeatherForecast.Run(...) |
| Forecast parsing | ForAll(ParseJSON(varWeather.forecastjson) As rec, ...) |
| Forecast collection | colForecast |
| Current weather record | varWeather |
| Dropdown items | colCapitals |
| Current container visibility | varViewMode = "Current" |
| Charts container visibility | varViewMode = "Charts" |
| Temperature chart items | ShowColumns(colForecast, "TimeText", "Temperature") |
| Wind chart items | ShowColumns(colForecast, "TimeText", "WindSpeed") |
| Rain chart items | ShowColumns(colForecast, "TimeText", "Rain") |
Reference Table
| Source | Why it matters |
|---|---|
| Microsoft Learn – Start a flow in a canvas app | Confirms Canvas Apps can trigger Power Automate flows from controls. |
| Open-Meteo Forecast API docs | Confirms support for current and hourly weather variables and timezone handling. |
| Microsoft Learn – Data operations in Power Automate | Supports Parse JSON and data shaping inside flows. |
Microsoft Learn – Set and variables | Supports global variable creation and app state management. |
Microsoft Learn – ClearCollect | Supports collection creation and loading for app data sources. |
| Microsoft Learn – ParseJSON and Dynamic values | Explains JSON parsing and dynamic field access in Power Fx. |
Microsoft Learn – ForAll | Supports iterating parsed JSON records and using As for record scope. |
| Microsoft Learn – DateTimeValue / Text | Supports formatting the returned API datetime into app-friendly text. |
| Microsoft Learn – Icon controls | Supports icon-based actions in Canvas Apps. |
| Microsoft Learn – Control properties / Visible | Supports formula-driven visibility in app controls. |
| Microsoft Learn – Chart controls | Explains how chart Items should be structured and how series are read. |
