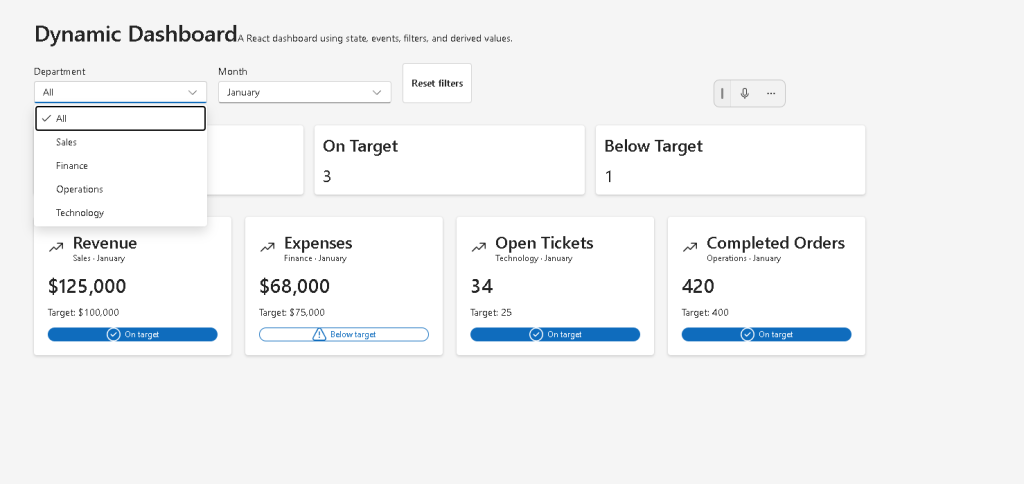
Technical Blog Article — App 40: Dynamic Dashboard with React, TypeScript, Fluent UI, and Derived State
App 40 closes Block 2 — Interactivity and State of the ReactLab roadmap. This stage is extremely important because it represents the transition from small isolated useState examples into a more realistic application architecture where multiple states work together to drive a dynamic user interface.
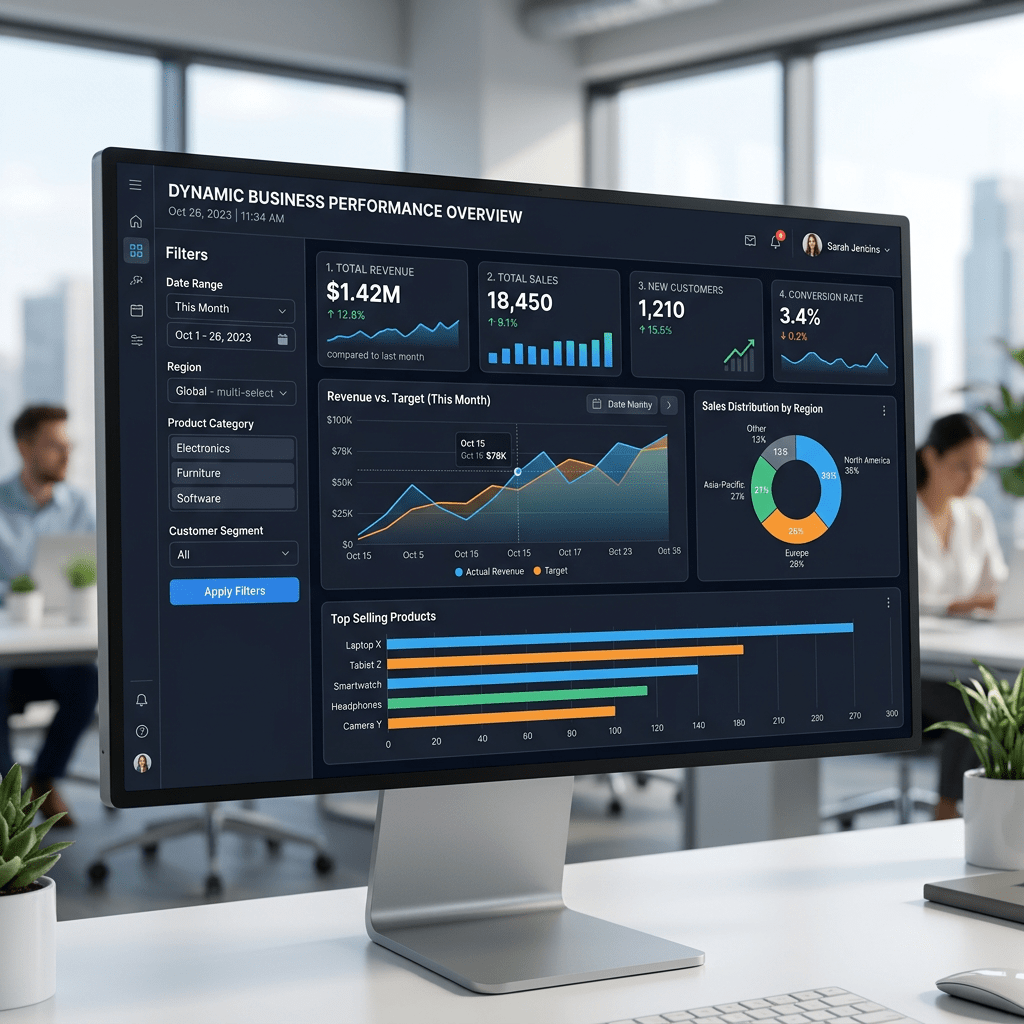
According to the project roadmap, App 40 is the Dynamic Dashboard, focused on state management, filters, events, derived state, and enterprise dashboard composition.
This application is intentionally important because dashboards are one of the most common structures in modern enterprise React systems. Almost every large corporate platform eventually evolves into some kind of dashboard:
- Microsoft 365 admin centers
- CRM systems
- ERP systems
- SharePoint portals
- analytics platforms
- Power BI style interfaces
- monitoring systems
- ticket systems
- operational portals
The goal of this app is not simply to show cards on the screen. The real goal is to teach the React mental model behind:
- dynamic rendering
- state-driven interfaces
- derived calculations
- filtering logic
- component communication
- reusable architecture
The application introduces a critical React concept:
The UI should always be derived from state.
This sentence sounds simple, but it is one of the deepest ideas in modern React.
Official React Concepts Used

This application directly connects to the official React Learn sections:
- Adding Interactivity
- Managing State
- Choosing the State Structure
- Sharing State Between Components
- Thinking in React
React Learn explains that state should be minimal and that values derivable from existing state should not be duplicated unnecessarily.
This app demonstrates exactly that.
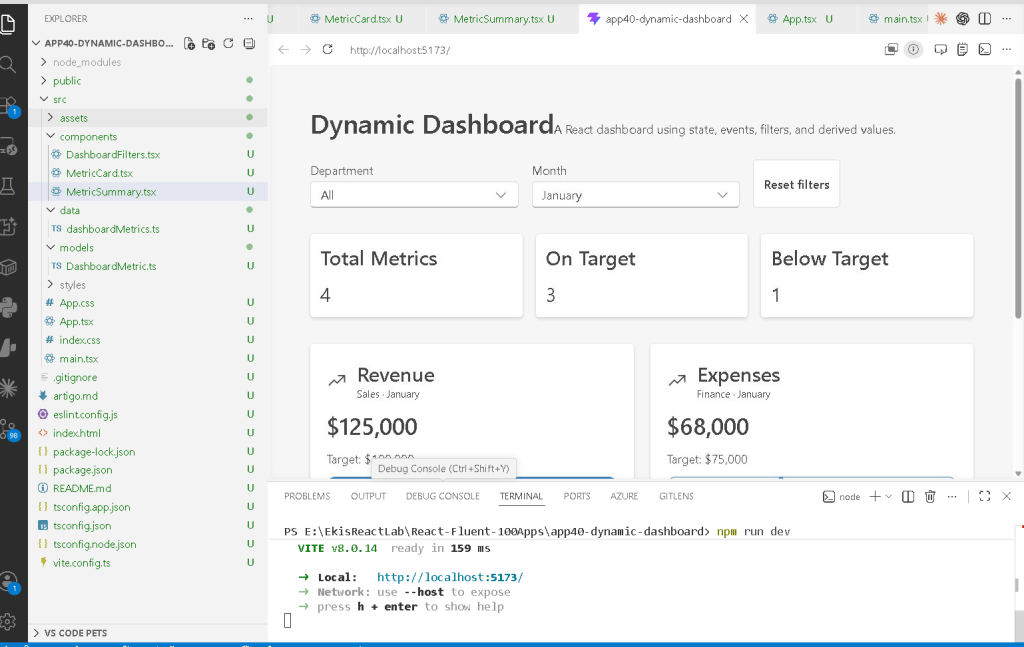
Creating the Project
PowerShell Commands
cd C:\ReactAppsNew-Item bloco02 -ItemType Directory -Forcecd bloco02npm create vite@latest app40-dynamic-dashboard -- --template react-tscd app40-dynamic-dashboardnpm installnpm install @fluentui/react-components @fluentui/react-icons
Creating the Folder Structure
New-Item src\models -ItemType Directory -ForceNew-Item src\data -ItemType Directory -ForceNew-Item src\components -ItemType Directory -ForceNew-Item src\styles -ItemType Directory -Force
Creating the Files
New-Item src\models\DashboardMetric.ts -ItemType FileNew-Item src\data\dashboardMetrics.ts -ItemType FileNew-Item src\components\DashboardFilters.tsx -ItemType FileNew-Item src\components\MetricCard.tsx -ItemType FileNew-Item src\components\MetricSummary.tsx -ItemType FileNew-Item artigo.md -ItemType File
The command:
New-Item artigo.md -ItemType File
is important because every app in the project generates a technical article for the learning repository.
Understanding the Application Architecture
The architecture is intentionally separated into layers:
src/ models/ data/ components/
Each layer has one responsibility.
The Role of models/
The folder:
src/models/
contains TypeScript contracts.
In this app:
DashboardMetric.ts
defines the shape of dashboard data.
This is important because React applications become much easier to maintain when data structures are explicit.
Understanding DashboardMetric.ts
export type Department = | "Sales" | "Finance" | "Operations" | "Technology";
This creates a TypeScript union type.
The application now restricts departments to known values.
This is extremely useful because TypeScript prevents invalid strings like:
"RandomDepartment"
The interface:
export interface DashboardMetric { id: number; title: string; department: Department; month: string; value: number; target: number; unit: string;}
defines the full structure of a metric.
This gives:
- autocomplete
- type safety
- architecture clarity
- safer refactoring
- easier debugging
The Role of data/
The folder:
src/data/
stores the application dataset.
In this app:
dashboardMetrics.ts
contains static dashboard information.
This simulates what later will become:
- API responses
- REST data
- GraphQL data
- database data
- SharePoint data
- analytics data
The important React idea here is:
Data lives outside the UI.
The UI should consume data rather than hardcoding everything directly in JSX.
Understanding the Dashboard Dataset
Each metric contains:
- department
- month
- current value
- target value
- unit
Example:
{ id: 1, title: "Revenue", department: "Sales", month: "January", value: 125000, target: 100000, unit: "$",}
This allows the dashboard to calculate:
- totals
- target status
- filtered lists
- KPI summaries
This is the foundation of analytics dashboards.
The Most Important File: App.tsx
The real heart of the app is:
src/App.tsx
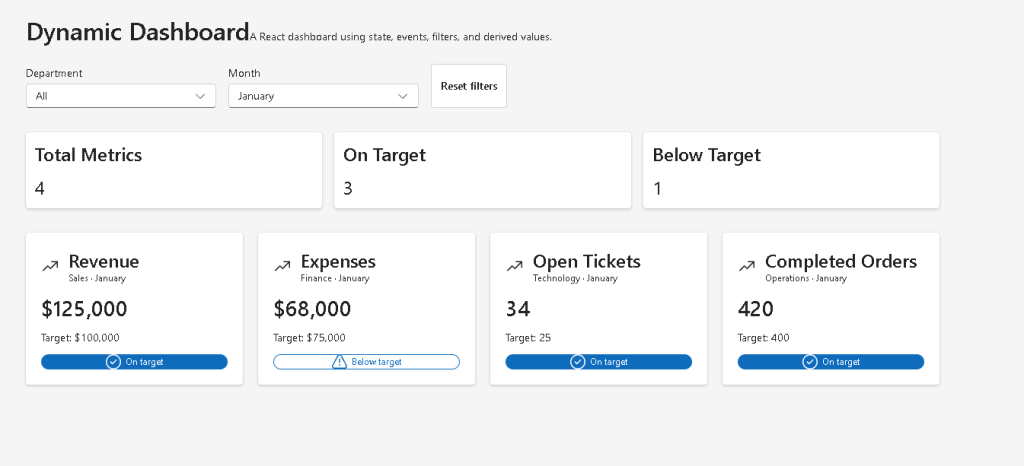
This component controls:
- dashboard filters
- selected department
- selected month
- filtered metrics
- KPI totals
This is where React state becomes the driver of the UI.
Understanding useState
The app starts with:
const [selectedDepartment, setSelectedDepartment] = useState<Department | "All">("All");const [selectedMonth, setSelectedMonth] = useState("January");
This is one of the most important React concepts.
React state represents:
- changing data
- user interaction
- component memory
React Learn calls state:
“A component’s memory.”
Understanding Array Destructuring
This syntax:
const [selectedDepartment, setSelectedDepartment]
is JavaScript array destructuring.
useState() returns two things:
[currentValue, updateFunction]
So:
selectedDepartment
contains the current state value.
And:
setSelectedDepartment
updates the state.
Why React Re-renders
When this runs:
setSelectedDepartment("Sales")
React:
- updates the state
- re-renders the component
- recalculates the JSX
- updates the screen
This is one of the core React mental models:
State changes→ React re-renders→ UI updates automatically
You do not manually manipulate HTML.
You change state.
React handles the rendering.
Understanding Derived State
This is the most important architectural part of the app:
const filteredMetrics = dashboardMetrics.filter((metric) => {
Notice something critical:
filteredMetrics is NOT state.
This is intentional.
React Learn explains:
If something can be calculated from existing state, it should not become separate state.
The dashboard already has:
- selectedDepartment
- selectedMonth
So the filtered list can be calculated dynamically.
This is called:
derived state
The app derives the filtered metrics from existing state.
Why This Is Better Than useEffect
Many beginners incorrectly write:
useEffect(() => { setFilteredMetrics(...)}, [...])
But React Learn specifically warns against unnecessary effects.
The correct solution is:
const filteredMetrics = ...
computed during render.
This app intentionally demonstrates the proper React architecture.
Understanding the Filter Logic
The filter logic:
const matchesDepartment = selectedDepartment === "All" || metric.department === selectedDepartment;
means:
If "All" is selected,accept every department.Otherwise,only accept matching departments.
Then:
const matchesMonth = metric.month === selectedMonth;
checks the selected month.
Finally:
return matchesDepartment && matchesMonth;
means both conditions must be true.
This is standard enterprise dashboard filtering logic.
Understanding KPI Calculations
The app calculates:
const totalOnTarget = filteredMetrics.filter( (metric) => metric.value >= metric.target ).length;
This dynamically calculates:
- how many metrics reached the target
Then:
const totalBelowTarget = filteredMetrics.length - totalOnTarget;
calculates:
- how many metrics failed the target
Again:
- no
useEffect - no duplicated state
- no manual synchronization
Everything derives from existing data.
The React Mental Model Here
The architecture becomes:
State →Derived calculations →JSX →Rendered UI
This is modern React.
Understanding DashboardFilters.tsx
This component receives:
- current filter values
- update functions
- reset function
This demonstrates:
- parent state ownership
- child component communication
The parent (App.tsx) owns the state.
The child (DashboardFilters.tsx) receives:
- props
- callbacks
This is React composition.
Understanding Callback Props
Example:
onDepartmentChange={setSelectedDepartment}
This passes the state updater function into the child component.
Inside the child:
onDepartmentChange(...)
updates the parent state.
This is how React components communicate upward.
Understanding Fluent UI Dropdown
The app uses:
<Dropdown>
with:
<Option>
This creates enterprise-style selection controls.
Fluent UI provides:
- accessibility
- keyboard navigation
- focus management
- enterprise styling
- Microsoft design consistency
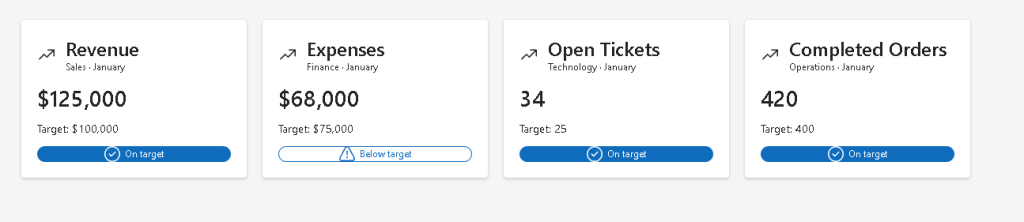
Understanding MetricCard.tsx
This component displays individual dashboard KPIs.
It receives:
metric: DashboardMetric
This demonstrates reusable component design.
Instead of manually writing multiple cards, React creates cards dynamically.
Understanding Conditional Rendering
Inside the card:
const isOnTarget = metric.value >= metric.target;
Then:
{isOnTarget ? "On target" : "Below target"}
This is conditional rendering.
React allows the UI to adapt dynamically depending on data.
Understanding Fluent UI Badge
The badge changes appearance dynamically:
appearance={ isOnTarget ? "filled" : "outline"}
This visually communicates status.
This pattern appears constantly in enterprise systems:
- success
- warning
- error
- pending
- approved
- rejected
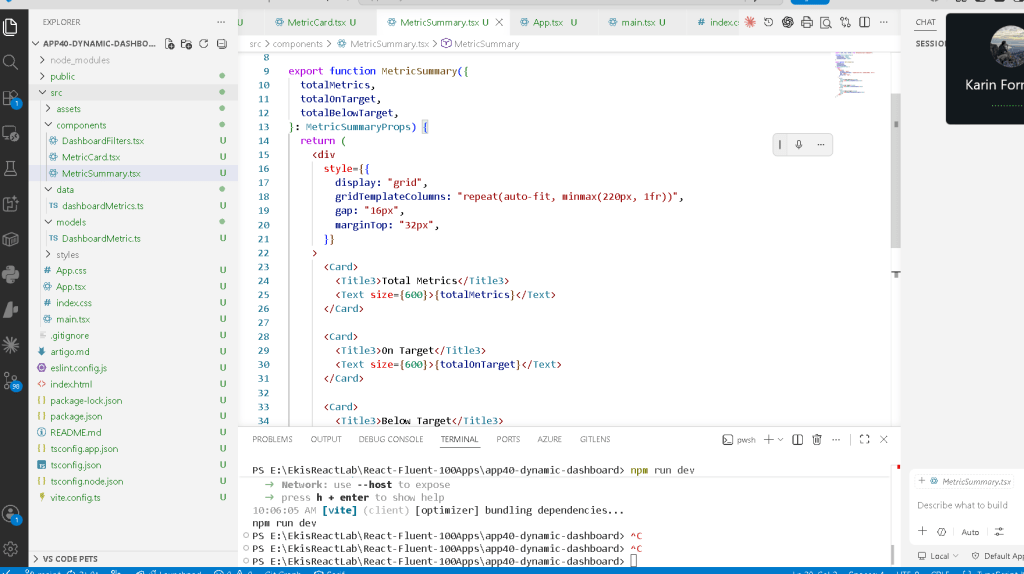
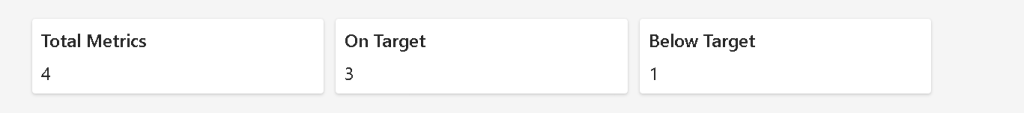
Understanding MetricSummary.tsx
This component calculates:
- total metrics
- on-target count
- below-target count
Notice:
- it does not own state
- it only receives props
This is a pure component.
React Learn strongly recommends pure components.
The Component Hierarchy
The app architecture becomes:
App DashboardFilters MetricSummary MetricCard[]
This is real React composition.
Each component has one responsibility.
Why This App Is Architecturally Important
This app introduces:
- multiple related states
- derived calculations
- reusable UI
- component communication
- enterprise filtering
- dashboard composition
- proper state ownership
- no unnecessary effects
This is a huge step toward professional React architecture.
Why No useEffect Yet?
This app intentionally avoids:
- API calls
- async logic
- synchronization
- side effects
Because React Learn explains:
Effects synchronize with external systems.
This dashboard is entirely internal state logic.
Therefore:
useEffectis unnecessary- state calculations should happen during rendering
This is correct modern React.
Understanding the Enterprise Dashboard Pattern
The structure introduced here is extremely common:
Filters →Derived data →Summary cards →Detailed cards
This same pattern later evolves into:
- Power BI dashboards
- admin portals
- analytics systems
- monitoring platforms
- SharePoint dashboards
So App 40 is much more important than it appears visually.
The Rendering Flow
The rendering flow becomes:
User changes dropdown →State updates →React re-renders →Filtered metrics recalculated →Summary recalculated →Cards re-rendered →Browser DOM updates
This is the React rendering cycle in practice.
Technical Summary
| Concept | Purpose |
|---|---|
useState | Component memory |
| Derived state | Calculated values |
filter() | Dynamic filtering |
map() | List rendering |
| Props | Component communication |
| Callback props | Child → parent updates |
| Fluent UI | Enterprise UI |
| Badge | Status rendering |
| Dropdown | Filter selection |
| Conditional rendering | Dynamic UI |
| Pure components | Predictable rendering |
| TypeScript | Safe architecture |
Official Documentation
React
- React Learn
- Adding Interactivity
- Managing State
- Choosing the State Structure
- Sharing State Between Components
- Thinking in React
- You Might Not Need an Effect
Fluent UI
Vite
TypeScript
Current Project Progress
| Block | App | Name | Status |
|---|---|---|---|
| Block 1 | 01–20 | Fundamentals and UI | Completed |
| Block 2 | 21 | Modern Counter | Completed |
| Block 2 | 22 | Toggle Theme | Completed |
| Block 2 | 23 | React Calculator | Completed |
| Block 2 | 24 | Login Form | Completed |
| Block 2 | 25 | User Registration | Completed |
| Block 2 | 26 | ToDo List | Completed |
| Block 2 | 27 | Shopping List | Completed |
| Block 2 | 28 | Product Filter | Completed |
| Block 2 | 29 | Employee Search | Completed |
| Block 2 | 30 | Shopping Cart | Completed |
| Block 2 | 31 | Grade Simulator | Completed |
| Block 2 | 32 | Inventory Control | Completed |
| Block 2 | 33 | Contact Agenda | Completed |
| Block 2 | 34 | Currency Converter | Completed |
| Block 2 | 35 | BMI Calculator | Completed |
| Block 2 | 36 | Installment Simulator | Completed |
| Block 2 | 37 | Voting Panel | Completed |
| Block 2 | 38 | Interactive Quiz | Completed |
| Block 2 | 39 | Team Manager | Completed |
| Block 2 | 40 | Dynamic Dashboard | Current |
| Block 3 | 41 | Login Microsoft Style | Next |
