Technical Blog Article — App 62: Dashboard with API using React, TypeScript, Vite, and Fluent UI
Introduction
In App 62 — Dashboard with API, we officially enter one of the most important phases of modern React development: synchronizing the user interface with external systems.
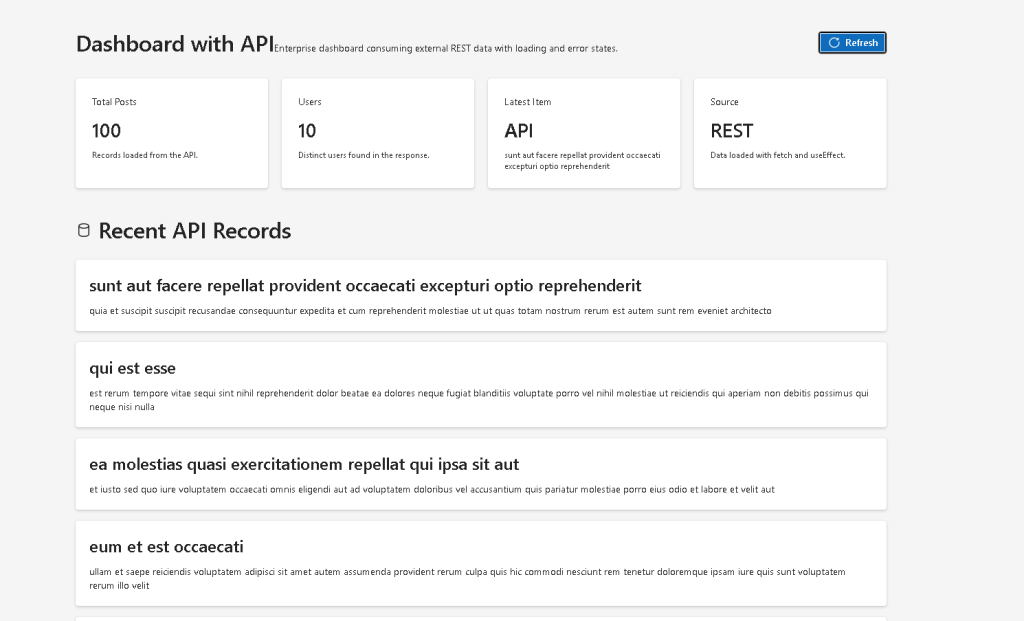
Until previous apps, most interfaces were static or driven only by local component state. Starting here, the application begins consuming real external data through HTTP requests. This transition is critical because almost every enterprise React application depends on APIs:
- dashboards
- SharePoint portals
- CRM systems
- ERP systems
- analytics platforms
- Microsoft 365 integrations
- reporting systems
- administrative panels
This app belongs to Block 4 — Effects and Architecture, where the focus is:
useEffect- asynchronous operations
- API architecture
- loading states
- error handling
- service layers
- derived dashboard metrics
- scalable React structure
According to the roadmap, App 62 is specifically:
“Dashboard with API / Loading + Error / Effects and Architecture”
The main objective is understanding the correct React mental model for external synchronization:
External API→ fetch request→ React state update→ component re-render→ UI updates automatically
This is the foundation for:
- real dashboards
- enterprise data systems
- analytics applications
- monitoring panels
- Microsoft-style admin interfaces
1. Why This App Matters
This app introduces the first truly enterprise-style dashboard architecture.
Even though the API used is simple, the architectural concepts are professional:
- isolated service layer
- typed API models
- loading state
- error state
- derived KPI calculations
- reusable dashboard cards
- component composition
- asynchronous rendering flow
The application intentionally separates:
- UI rendering
- data fetching
- business structure
- derived metrics
This separation is extremely important for scalability.
2. Create the Project
Create the folder
cd C:\ReactAppsNew-Item bloco04 -ItemType Directorycd bloco04
Create the Vite React TypeScript app
npm create vite@latest app62-dashboard-with-api -- --template react-tscd app62-dashboard-with-api
Install dependencies
npm installnpm install @fluentui/react-components @fluentui/react-icons
3. Create the Folder Structure
New-Item src\components -ItemType DirectoryNew-Item src\services -ItemType DirectoryNew-Item src\models -ItemType DirectoryNew-Item src\styles -ItemType Directory
Create files:
New-Item src\models\DashboardPost.ts -ItemType FileNew-Item src\services\dashboardService.ts -ItemType FileNew-Item src\components\KpiCard.tsx -ItemType FileNew-Item src\components\PostsPanel.tsx -ItemType FileNew-Item artigo.md -ItemType File
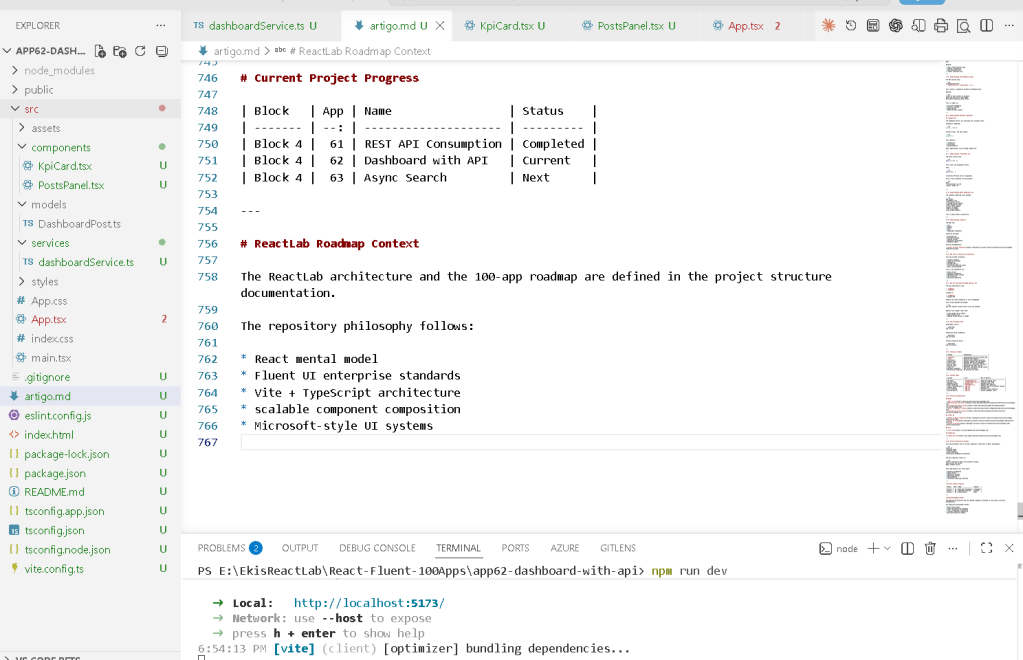
4. Final Project Structure
app62-dashboard-with-api/ src/ components/ KpiCard.tsx PostsPanel.tsx services/ dashboardService.ts models/ DashboardPost.ts styles/ App.tsx main.tsx index.css artigo.md package.json vite.config.ts
This structure already resembles professional React architecture.
Each folder has one responsibility:
| Folder | Responsibility |
|---|---|
components/ | Reusable UI blocks |
services/ | API communication |
models/ | TypeScript data contracts |
styles/ | Shared styling |
App.tsx | Root dashboard composition |
5. Understanding the Data Model
DashboardPost.ts
export interface DashboardPost { userId: number; id: number; title: string; body: string;}
This file defines the structure returned by the API.
The API response becomes predictable:
userIdidtitlebody
Without TypeScript interfaces:
- API shapes become uncertain
- refactoring becomes dangerous
- runtime bugs become more common
This model acts as a contract between:
- the backend API
- the frontend dashboard
6. Why Service Layers Matter
dashboardService.ts
const API_URL = "https://jsonplaceholder.typicode.com/posts";
The app intentionally isolates the fetch logic into a service layer.
This is extremely important.
Bad architecture:
fetch(...)inside App.tsx
Better architecture:
service layer→ reusable API functions→ UI components remain cleaner
This separation improves:
- maintainability
- testing
- scalability
- readability
7. Understanding Async Functions
export async function getDashboardPosts()
The keyword:
async
means the function returns a Promise.
Inside:
await fetch(API_URL)
React waits for the API response.
The rendering flow becomes:
Component renders→ fetch starts→ waiting...→ response arrives→ state updates→ React re-renders
8. Understanding Error Handling
if (!response.ok) { throw new Error("Failed to load dashboard data.");}
This checks whether the request succeeded.
Without this validation:
- failed requests may silently break
- dashboards may display invalid data
- debugging becomes difficult
Enterprise dashboards must always handle:
- loading
- success
- failure
9. Understanding useEffect
The most important part of the app is:
useEffect(() => { loadDashboardData();}, []);
This is the first real synchronization effect.
React Learn explains:
Effects synchronize your components with external systems.
Official documentation:
The API is an external system.
Therefore:
useEffectis appropriate here.
10. Why the Dependency Array Matters
[],
The empty dependency array means:
Run this effect once after the component mounts.
Without it:
useEffect(() => { loadDashboardData();});
the API would run after every render, creating an infinite loop.
This is one of the most important beginner lessons in React effects.
11. Understanding Loading State
const [loading, setLoading] = useState(true);
Loading state controls the spinner.
The flow becomes:
Start request→ loading = true→ Spinner appearsAPI finishes→ loading = false→ Dashboard appears
This creates better UX because users understand that data is still loading.
12. Understanding Error State
const [error, setError] = useState("");
If the API fails:
setError("Could not load dashboard data.");
React re-renders and shows the error message.
This is declarative rendering:
State changes→ UI changes automatically
13. Understanding Derived Dashboard Metrics
The app calculates KPIs from the API data:
const totalPosts = posts.length;
const totalUsers = new Set(posts.map((post) => post.userId)).size;
These values are NOT stored in state.
They are derived from existing state.
This follows React best practices:
- avoid redundant state
- derive values when possible
Official documentation:
14. Why Derived State Is Better
Bad approach:
const [totalPosts, setTotalPosts]
Good approach:
const totalPosts = posts.length;
Why?
Because:
- fewer synchronization bugs
- simpler architecture
- less duplicated data
- cleaner rendering flow
15. Understanding the Dashboard Layout
The KPI section uses:
gridTemplateColumns: "repeat(auto-fit, minmax(240px, 1fr))"
This creates a responsive enterprise dashboard grid.
Meaning:
Create as many columns as possible.Each card must be at least 240px.Distribute remaining space evenly.
This is common in:
- Microsoft dashboards
- analytics systems
- admin portals
- Power BI-style layouts
16. Understanding Reusable Components
KpiCard.tsx
The dashboard metrics are extracted into reusable cards.
Instead of repeating:
<Card>...</Card>
multiple times, the app creates:
<KpiCard />
This improves:
- reusability
- consistency
- maintainability
React applications scale through composition.
17. Understanding PostsPanel.tsx
The posts section uses:
posts.slice(0, 6)
This limits the displayed results.
Then:
posts.map(...)
transforms API data into UI components.
This is one of React’s core principles:
Data→ transformed into JSX→ React renders UI
18. Understanding React Rendering Flow
The complete rendering cycle becomes:
App renders→ useEffect runs→ API request starts→ loading spinner appears→ API response arrives→ posts state updates→ React re-renders→ KPI cards update→ Posts panel appears
This is modern React architecture.
19. Understanding Fluent UI
The app uses:
- Card
- Spinner
- Button
- Text
- Typography components
Fluent UI provides:
- accessibility
- Microsoft styling
- spacing systems
- enterprise consistency
- keyboard support
Official documentation:
20. Why This Is Enterprise Architecture
This app already introduces:
- service isolation
- typed API contracts
- reusable UI
- derived metrics
- controlled rendering states
- async synchronization
This is the foundation for:
- admin portals
- analytics dashboards
- SharePoint-style systems
- CRM interfaces
- monitoring platforms
21. Why This App Does NOT Need Reducers Yet
The app intentionally uses:
useStateuseEffect
instead of:
useReducer- Context API
because the state complexity is still manageable.
This follows React’s philosophy:
Use the simplest solution that solves the problem.
Reducers will appear later when:
- state becomes more complex
- many actions exist
- updates become harder to manage
22. Run the Application
Development server:
npm run dev
Production build validation:
npm run build
Preview production build:
npm run preview
23. Technical Summary
| Concept | Explanation |
|---|---|
useEffect | Synchronizes with the external API |
fetch | Performs HTTP request |
| Async/Await | Handles asynchronous operations |
| Loading state | Displays spinner during requests |
| Error state | Displays API failure feedback |
| Derived state | KPI metrics calculated from posts |
| Service layer | Separates API logic from UI |
| Fluent UI | Microsoft enterprise design system |
| Reusable components | KPI cards and panels |
| Declarative rendering | UI derived from state |
24. Concept Table
| Concept | File | Why It Matters |
|---|---|---|
| API model | DashboardPost.ts | Keeps API typing safe |
| Service layer | dashboardService.ts | Isolates HTTP logic |
| Dashboard cards | KpiCard.tsx | Reusable metrics UI |
| Posts rendering | PostsPanel.tsx | Dynamic API rendering |
| Effect synchronization | App.tsx | Connects React to external systems |
| Loading state | App.tsx | Improves UX |
| Error handling | App.tsx | Prevents silent failures |
| Derived metrics | App.tsx | Avoids redundant state |
25. Official Documentation
React
- React Learn
- Synchronizing with Effects
- You Might Not Need an Effect
- State: A Component’s Memory
- Choosing the State Structure
Fluent UI
Vite
TypeScript
26. Final Architectural Insight
This app introduces one of the most important transitions in React development:
Static UI→ Dynamic State→ External Data→ Async Rendering→ Enterprise Dashboard Architecture
The most important lesson is:
Effects synchronize React with external systems.State stores the result.React renders the UI.
That same pattern will later power:
- analytics dashboards
- admin centers
- SharePoint portals
- monitoring systems
- CRM dashboards
- enterprise reporting platforms
Current Project Progress
| Block | App | Name | Status |
|---|---|---|---|
| Block 4 | 61 | REST API Consumption | Completed |
| Block 4 | 62 | Dashboard with API | Current |
| Block 4 | 63 | Async Search | Next |
ReactLab Roadmap Context
The ReactLab architecture and the 100-app roadmap are defined in the project structure documentation.
The repository philosophy follows:
- React mental model
- Fluent UI enterprise standards
- Vite + TypeScript architecture
- scalable component composition
- Microsoft-style UI systems


