
Segue o artigo completo para o App 73 — Analytical Dashboard, no padrão ReactLab.
App 73 — Analytical Dashboard
Building an Enterprise Analytics Dashboard with React, TypeScript, Fluent UI, and Modern React Architecture
Introduction
Modern enterprise applications revolve around data. Whether we are building administrative portals, CRM systems, ERP platforms, SharePoint-inspired solutions, or executive dashboards, the ultimate goal is usually the same: transform raw information into actionable insights.
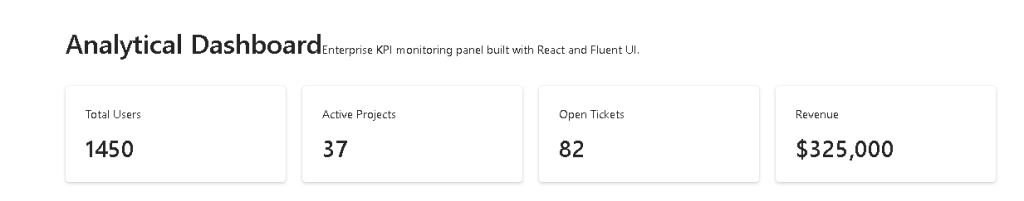
In App 73 — Analytical Dashboard, we introduce one of the most common patterns found in professional React applications: the KPI Dashboard.
This application belongs to Block 4 — Effects and Architecture and combines several concepts learned in previous applications:
- React Components
- TypeScript Models
- Service Layer Pattern
- useState
- useEffect
- Conditional Rendering
- Fluent UI
- Responsive Layouts
- Enterprise Architecture
The objective is not simply displaying cards on the screen.
The objective is understanding how React applications retrieve information from external systems and transform that information into meaningful visual components.
This application follows the official React philosophy:
UI = f(State)
The dashboard does not manually update HTML elements.
Instead:
Service returns data↓State changes↓React re-renders↓Dashboard updates automatically
This is the React mental model.
Creating the Project
Create the project using Vite and TypeScript.
mkdir bloco04cd bloco04npm create vite@latest app73-analytical-dashboard -- --template react-tscd app73-analytical-dashboardnpm installnpm install @fluentui/react-components @fluentui/react-icons
Create the folders:
New-Item src\components -ItemType DirectoryNew-Item src\services -ItemType DirectoryNew-Item src\models -ItemType DirectoryNew-Item src\styles -ItemType Directory
Create the files:
New-Item src\models\DashboardMetrics.ts -ItemType FileNew-Item src\services\dashboardService.ts -ItemType FileNew-Item src\components\DashboardHeader.tsx -ItemType FileNew-Item src\components\KpiCard.tsx -ItemType FileNew-Item src\components\MetricsGrid.tsx -ItemType FileNew-Item artigo.md -ItemType File
Final Folder Structure
src/│├── components/│ ├── DashboardHeader.tsx│ ├── KpiCard.tsx│ └── MetricsGrid.tsx│├── models/│ └── DashboardMetrics.ts│├── services/│ └── dashboardService.ts│├── styles/│├── App.tsx├── main.tsx└── index.css
This architecture follows a very common enterprise pattern.
Each folder has a single responsibility.
Understanding the Model Layer
The model layer defines the structure of the information used by the application.
export interface DashboardMetrics { totalUsers: number; activeProjects: number; openTickets: number; revenue: number;}
The interface defines the shape of the data.
Benefits:
- Type safety
- Better autocomplete
- Safer refactoring
- Predictable architecture
One important note:
Since this is an interface, modern TypeScript projects require:
import type { DashboardMetrics }from "../models/DashboardMetrics";
instead of:
import { DashboardMetrics }from "../models/DashboardMetrics";
because Vite enables:
"verbatimModuleSyntax": true
by default.
Why a Service Layer Exists
A common beginner mistake is placing API logic directly inside components.
Bad:
function App() { fetch(...)}
Professional architecture:
Service Layer ↓React Component ↓UI
The service becomes responsible for retrieving data.
The component becomes responsible for rendering data.
This separation makes applications easier to maintain.
Simulating an Enterprise API
The service simulates a REST API.
export async function getDashboardMetrics() { await new Promise(resolve => setTimeout(resolve, 1200) ); return { totalUsers: 1450, activeProjects: 37, openTickets: 82, revenue: 325000, };}
The artificial delay allows us to visualize loading behavior.
Real systems frequently wait for:
- APIs
- Databases
- Authentication Providers
- SharePoint Services
- Microsoft Graph
Loading states become critical.
Understanding React Effects
One of the most important concepts introduced in this application is:
useEffect()
The dashboard needs to retrieve information when the component appears.
React provides Effects specifically for this purpose.
useEffect(() => { loadMetrics();}, []);
The empty dependency array means:
Run once when the component mounts.
The execution flow becomes:
Component loads↓Effect executes↓Service is called↓Data returns↓State updates↓React re-renders
This is the correct use of Effects.
Understanding State
The application uses two state variables.
const [metrics, setMetrics]const [loading, setLoading]
Each one has a different responsibility.
Metrics State
Stores business information.
UsersProjectsTicketsRevenue
Loading State
Controls user feedback.
Loading...
while data is being retrieved.
Without loading states, dashboards often appear broken.
Professional applications always communicate system status.
Conditional Rendering
The dashboard displays different interfaces depending on state.
Loading:
<Spinner />
Loaded:
<MetricsGrid />
React evaluates the current state and renders the appropriate interface.
This is called Conditional Rendering.
Instead of:
Show spinner manuallyHide spinner manuallyShow dashboard manually
React simply evaluates state.
KPI Cards
The KPI card is the primary building block of the dashboard.
Each card displays:
MetricValue
Examples:
Total Users1450Revenue$325,000Open Tickets82
These components appear everywhere in enterprise software.
Examples:
- Microsoft Admin Center
- SharePoint Dashboards
- Power BI Portals
- CRM Systems
- ERP Applications
Because they allow decision makers to quickly understand business performance.
Component Composition
The application follows a layered component architecture.
App│├── DashboardHeader│└── MetricsGrid │ ├── KpiCard ├── KpiCard ├── KpiCard └── KpiCard
Benefits:
- Reusability
- Simplicity
- Scalability
- Maintainability
Each component has a single responsibility.
Responsive Design
The dashboard uses CSS Grid.
gridTemplateColumns:"repeat(auto-fit,minmax(250px,1fr))"
This creates responsive behavior automatically.
Large screens:
[Card][Card][Card][Card]
Medium screens:
[Card][Card][Card][Card]
Small screens:
[Card][Card][Card][Card]
No additional JavaScript is required.
CSS Grid handles the adaptation.
Why Fluent UI
Fluent UI provides:
- Microsoft styling
- Accessibility
- Responsive behavior
- Design consistency
- Enterprise-grade components
Instead of creating everything manually:
<div>
we use:
<Card>
which already includes:
- spacing
- borders
- typography
- accessibility
This accelerates enterprise development.
React Mental Model
The most important lesson from App 73 is understanding how React thinks.
Many developers initially think:
Get dataFind HTMLUpdate HTML
That is not React.
React expects:
Get dataUpdate stateReact updates UI
The dashboard demonstrates this perfectly.
The service returns information.
State changes.
React automatically updates the interface.
No DOM manipulation is necessary.
Enterprise Architecture Introduced
This application introduces several important enterprise patterns.
Model Layer
models/
Defines data structures.
Service Layer
services/
Handles external systems.
Presentation Layer
components/
Displays information.
Container Layer
App.tsx
Coordinates state and effects.
These patterns appear repeatedly in large React applications.
Technical Summary
| Concept | Description |
|---|---|
| useEffect | Synchronizes with external services |
| useState | Stores dashboard state |
| Service Layer | Retrieves business data |
| Fluent UI | Enterprise design system |
| KPI Cards | Dashboard metrics |
| TypeScript Models | Strong typing |
| Conditional Rendering | Loading vs Dashboard |
| CSS Grid | Responsive layout |
| Component Composition | Modular architecture |
| Async/Await | Asynchronous data loading |
Official Documentation
React Learn
Synchronizing with Effects
State: A Component’s Memory
Conditional Rendering
Fluent UI
Fluent UI Card
Vite
TypeScript
Final Insight
App 73 is much more than a dashboard.
It introduces the foundation of modern enterprise React architecture:
External Data↓Service Layer↓React Effect↓State↓Components↓Business Dashboard
This same architecture will be reused in future applications such as analytics systems, administrative portals, SharePoint-inspired solutions, reporting systems, and enterprise dashboards.
Mastering App 73 means understanding one of the most important patterns in professional React development.
Current Progress
| Block | App | Name | Status |
|---|---|---|---|
| Block 4 | 61 | REST API Consumption | Completed |
| Block 4 | 62 | API Dashboard | Completed |
| Block 4 | 63 | Async Search | Completed |
| Block 4 | 64 | GitHub Explorer | Completed |
| Block 4 | 65 | Weather App | Completed |
| Block 4 | 66 | Pagination System | Completed |
| Block 4 | 67 | Infinite Scroll | Completed |
| Block 4 | 68 | Data Cache | Completed |
| Block 4 | 69 | Custom Fetch Hook | Completed |
| Block 4 | 70 | Context API Control | Completed |
| Block 4 | 71 | Favorites System | Completed |
| Block 4 | 72 | API DataGrid | Completed |
| Block 4 | 73 | Analytical Dashboard | Current |
| Block 4 | 74 | Cryptocurrency Monitor | Next |
