Claro. Segue o início de um artigo técnico completo para WordPress, no padrão que estamos usando para a série ReactLab.
App 77 — Building an Enterprise Reporting System with React, TypeScript, Fluent UI, useEffect, and useMemo
Introduction
As applications evolve from simple user interfaces into enterprise-grade solutions, reporting becomes one of the most important capabilities organizations require. Executives, managers, analysts, and operational teams depend on dashboards and reports to understand business performance, identify trends, monitor KPIs, and make informed decisions.
In modern React applications, reporting systems are much more than tables displaying records. They involve:
- Data retrieval
- Filtering
- Aggregation
- Statistics generation
- Dashboard summaries
- Performance optimization
- Component architecture
- Enterprise user experience
In App 77 — Reporting System, part of the ReactLab 100 Apps roadmap, we build a reporting dashboard using:
- React 19
- TypeScript
- Vite
- Fluent UI
- useEffect
- useMemo
- Service Layer Architecture
This application belongs to Block 4 — Effects and Architecture, where we start focusing on professional React patterns that appear in real-world corporate applications.
Examples include:
- SharePoint Dashboards
- Microsoft 365 Portals
- CRM Systems
- ERP Platforms
- Power BI Portals
- Executive Reporting Systems
- Operational Monitoring Platforms
The objective is not only to display reports but to understand how React organizes data flow inside enterprise applications.
Why Reporting Systems Matter
Every company generates data.
Examples:
- Sales transactions
- Financial information
- Employee metrics
- Support tickets
- Inventory records
- Customer interactions
Raw data has little value by itself.
Businesses need answers such as:
- How many reports exist?
- Which department generates the most activity?
- What reports are being accessed most frequently?
- Which categories are growing?
- What trends should management monitor?
A reporting system transforms information into actionable insights.
This is why reporting modules exist in virtually every enterprise platform.
Project Architecture
One of the main goals of this application is demonstrating architecture.
The solution follows a layered structure:
src/│├── models/│├── data/│├── services/│├── components/│├── App.tsx│├── main.tsx│└── index.css
Each layer has a specific responsibility.
This separation is critical because enterprise applications can easily grow into hundreds of components and thousands of lines of code.
Without architectural discipline, maintenance becomes increasingly difficult.
Understanding the Model Layer
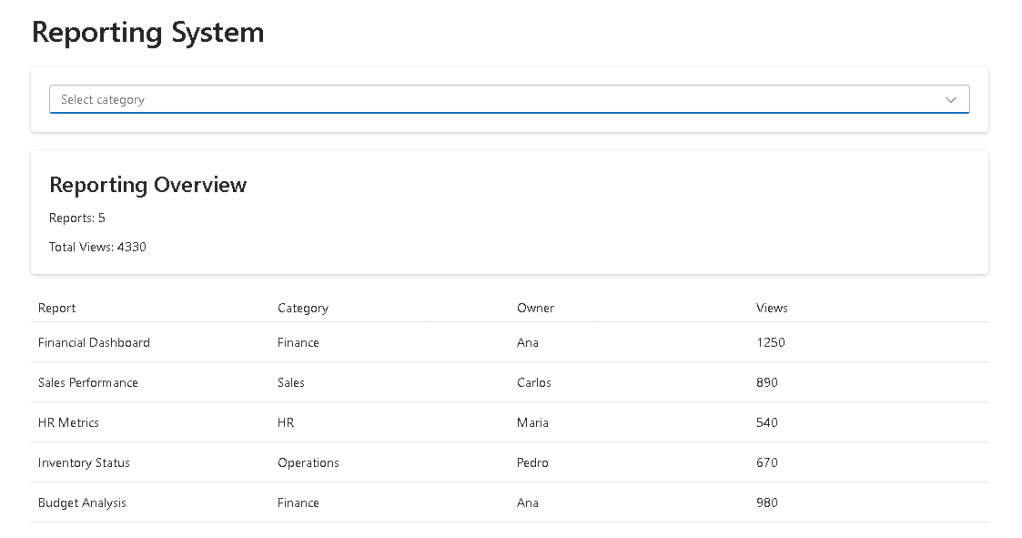
The application starts by defining the report structure.
export interface Report { id: number; title: string; category: string; owner: string; views: number;}
This TypeScript interface acts as a contract.
Every report must contain:
| Property | Purpose |
|---|---|
| id | Unique identifier |
| title | Report name |
| category | Business area |
| owner | Responsible user |
| views | Usage metric |
This creates consistency across the entire application.
TypeScript immediately warns developers if a report object is missing required properties.
Benefits include:
- Strong typing
- Better IntelliSense
- Safer refactoring
- Reduced runtime errors
- Easier maintenance
Enterprise applications rely heavily on this approach.
Why a Service Layer Exists
Many developers initially load data directly inside React components.
While that works for small examples, it becomes problematic as applications grow.
Instead, App 77 introduces a service layer.
export async function getReports() { return Promise.resolve(reports);}
At first glance this seems unnecessary because the data is local.
However, the architecture is intentionally designed this way because later the implementation can change to:
const response = await fetch("/api/reports");
without affecting any UI components.
This concept is known as:
Separation of Concerns
The service is responsible for obtaining data.
The UI is responsible for displaying data.
Each layer focuses on a single responsibility.
This pattern appears constantly in enterprise React applications.
Loading Data with useEffect
When the application starts, it loads reports through the service layer.
useEffect(() => { getReports().then(setReports);}, []);
This introduces one of React’s most important hooks.
The dependency array:
[]
tells React:
Execute only once when the component mounts.
The effect is used because data retrieval represents synchronization with an external system.
Even though our data is local, the architecture mirrors what would happen with a real API.
According to React Learn:
Effects should synchronize your components with external systems.
This is exactly what happens here.
Understanding Derived State
One of the most important lessons in this application is avoiding duplicated state.
The selected category is stored:
const [category, setCategory] = useState("");
But the filtered reports are not stored.
Instead:
const filteredReports = reports.filter(...)
or in our case:
useMemo(...)
This follows React’s recommendation:
Store the minimum state necessary.
The filtered collection can always be derived from:
- reports
- category
Therefore it should not be stored separately.
Benefits:
- Less synchronization logic
- Fewer bugs
- Cleaner architecture
- Easier maintenance
Why useMemo Is Important
The application uses useMemo for:
- Filtering reports
- Calculating totals
Example:
const totalViews = useMemo(() => { return filteredReports.reduce( (sum, report) => sum + report.views, 0 );}, [filteredReports]);
Without memoization:
Every render→ Execute calculations again
With useMemo:
Only recalculate when dependencies change
For small datasets the difference is negligible.
For enterprise datasets containing thousands of records, memoization becomes extremely important.
This app introduces that mindset early.
Building Dashboard Summaries
One of the most common patterns in executive dashboards is displaying aggregated information.
Examples:
- Total Reports
- Total Views
- Total Revenue
- Total Customers
- Open Tickets
Instead of forcing users to analyze individual records, summary cards provide immediate insight.
Our Reporting Summary component demonstrates this concept.
This is exactly the same approach used by:
- Power BI
- Microsoft Admin Center
- Dynamics 365
- SharePoint Dashboards
Fluent UI and Enterprise Design
Fluent UI provides the visual foundation for the application.
Components used include:
- Card
- Dropdown
- Table
- Text
- Title
Benefits:
- Accessibility
- Consistent typography
- Keyboard navigation
- Microsoft design standards
- Responsive layouts
Instead of manually styling controls, developers focus on business logic.
This significantly improves productivity.
React Rendering Flow
One of the most important concepts reinforced by this application is:
UI = Function(State)
The reporting dashboard works like this:
User selects category→ category state changesReact re-rendersfilteredReports recalculatestotalViews recalculatesDashboard updates automatically
No manual DOM manipulation is necessary.
The developer describes what the UI should look like.
React handles the updates.
Enterprise Patterns Introduced
App 77 introduces several patterns used in production systems:
| Pattern | Purpose |
|---|---|
| Service Layer | Data retrieval |
| useEffect | Data synchronization |
| useMemo | Performance optimization |
| Derived State | Reduced complexity |
| Component Composition | Reusability |
| Dashboard Cards | KPI visualization |
| Data Filtering | User-driven reports |
| Fluent UI | Enterprise design system |
These patterns will appear repeatedly in future applications.
Technical Summary
| Technology | Purpose |
|---|---|
| React | UI rendering |
| TypeScript | Static typing |
| Vite | Development tooling |
| Fluent UI | Enterprise design system |
| useState | Component memory |
| useEffect | Data loading |
| useMemo | Optimized calculations |
| Service Layer | Data access abstraction |
| Components | UI composition |
| Dashboard Architecture | Business reporting |
Official Documentation
React
Fluent UI
Vite
TypeScript
Final Thoughts
App 77 may appear simple from a visual perspective, but architecturally it introduces several concepts that form the foundation of enterprise React development.
The application demonstrates how to:
- Load data correctly
- Separate responsibilities
- Avoid redundant state
- Optimize calculations
- Build dashboard summaries
- Organize React projects professionally
Most importantly, it reinforces the React philosophy:
Store minimal state.Derive everything else.
This principle scales from small applications to enterprise platforms containing hundreds of screens and millions of records.
Mastering these concepts now will make future dashboard, analytics, monitoring, and reporting applications significantly easier to build.
PowerShell Commands Used
mkdir bloco04cd bloco04npm create vite@latest app77-reporting-system -- --template react-tscd app77-reporting-systemnpm installnpm install @fluentui/react-components @fluentui/react-iconsmkdir src\componentsmkdir src\modelsmkdir src\servicesmkdir src\datamkdir src\stylesNew-Item src\models\Report.ts -ItemType FileNew-Item src\data\reports.ts -ItemType FileNew-Item src\services\reportService.ts -ItemType FileNew-Item src\components\ReportSummary.tsx -ItemType FileNew-Item src\components\ReportFilter.tsx -ItemType FileNew-Item src\components\ReportGrid.tsx -ItemType FileNew-Item artigo.md -ItemType File
Current Progress
| Block | App | Name | Status |
|---|---|---|---|
| Block 4 | 74 | Crypto Monitor | Completed |
| Block 4 | 75 | Repository Explorer | Completed |
| Block 4 | 76 | Log Viewer Dashboard | Completed |
| Block 4 | 77 | Reporting System | Completed |
| Block 4 | 78 | Performance Simulator | Next |
Current App: 77/100
Current Block: Block 4 — Effects and Architecture
Next App: 78 — Performance Simulator 🚀
