Technical Blog Article — App 98: Analytics System with React, TypeScript, Fluent UI, and Enterprise Dashboard Architecture
Introduction
As organizations become increasingly data-driven, analytics platforms have evolved into one of the most important categories of enterprise software. Executives, managers, analysts, and operational teams rely on dashboards to transform raw data into actionable insights.
In App 98 — Analytics System, we build a Microsoft-style analytics platform using React, TypeScript, Vite, and Fluent UI. This application belongs to Block 5 — Complete Applications, where all previously learned concepts are combined into professional enterprise solutions.
The objective of this application is not merely to display numbers on the screen. Instead, it demonstrates how React applications can organize, structure, and present business metrics using reusable components, strongly typed models, and scalable architecture patterns.
This application simulates an enterprise analytics portal capable of displaying:
- Key Performance Indicators (KPIs)
- Department metrics
- Business trends
- Operational indicators
- Executive summaries
- Management dashboards
The project follows the principles established throughout ReactLab:
- UI derived from data
- Component composition
- TypeScript-first architecture
- Fluent UI enterprise design
- Separation of concerns
- Scalable project organization
The concepts applied here are directly relevant to real-world systems such as:
- Power BI portals
- SharePoint dashboards
- CRM analytics
- ERP reporting systems
- Executive KPI centers
- Operations monitoring portals
- Microsoft 365 reporting solutions
Why Analytics Systems Matter
Modern organizations generate enormous amounts of data.
Examples include:
- Sales transactions
- Support tickets
- User activity
- Financial reports
- Marketing campaigns
- Inventory records
- Compliance logs
Without analytics systems, this information remains disconnected and difficult to interpret.
Analytics dashboards transform data into information.
Information becomes insights.
Insights support decision-making.
The process can be summarized as:
Raw Data→ Metrics→ Analytics→ Insights→ Decisions
This application demonstrates how React can participate in that process.
Enterprise Dashboard Architecture
One of the primary goals of App 98 is to reinforce architectural separation.
Instead of placing everything inside App.tsx, the solution is divided into multiple layers:
App └── AnalyticsDashboard ├── AnalyticsSummary └── AnalyticsGrid
Each component has a single responsibility.
This approach follows the React philosophy of composition over complexity.
Benefits include:
- easier maintenance
- easier testing
- reusable components
- better scalability
- cleaner code organization
As applications grow, this becomes increasingly important.
Understanding the Analytics Model
The file:
src/models/AnalyticsMetric.ts
defines the business structure of a metric.
export interface AnalyticsMetric { id: number; category: string; metric: string; value: number; trend: string; owner: string;}
This interface establishes a contract.
Every metric must contain:
| Property | Purpose |
|---|---|
| id | Unique identifier |
| category | Business area |
| metric | KPI name |
| value | Current measurement |
| trend | Performance direction |
| owner | Responsible department |
TypeScript guarantees that all analytics data follows this structure.
This prevents common enterprise errors caused by inconsistent data.
Data-Driven Rendering
The application stores analytics information inside:
src/data/analyticsData.ts
The dashboard does not hardcode visual elements.
Instead, it renders data dynamically.
This follows one of React’s most important principles:
UI = Function(Data)
React receives data.
Components render that data.
When data changes, the UI changes automatically.
This approach allows future integrations with:
- REST APIs
- Graph APIs
- SharePoint lists
- SQL databases
- Azure services
- Power BI datasets
without changing the visual architecture.
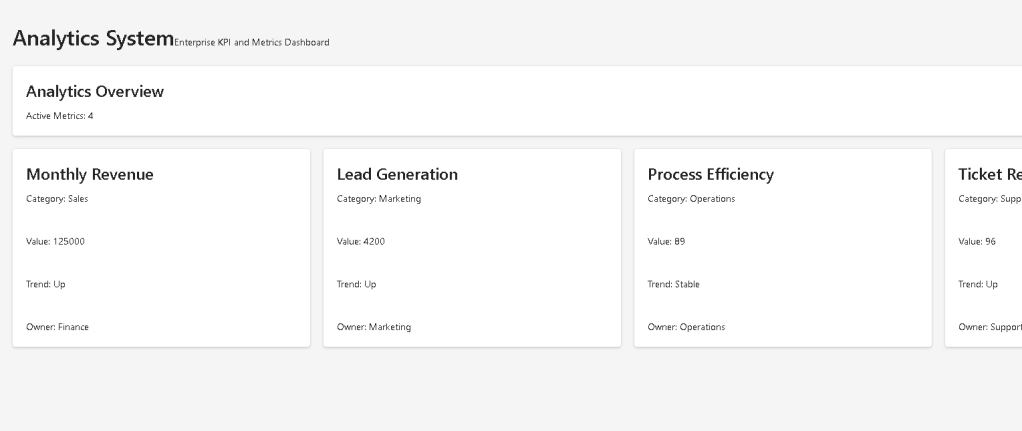
AnalyticsSummary Component
The summary component represents a common enterprise dashboard pattern.
Its purpose is to provide a high-level overview before users dive into details.
The component receives:
totalMetrics
and displays:
Analytics OverviewActive Metrics: X
This demonstrates a key React concept:
Props
Props allow parent components to provide information to child components.
Instead of hardcoding values, components become reusable.
The same summary component could later display:
- Total Users
- Total Revenue
- Total Tickets
- Total Projects
- Total Customers
without requiring structural modifications.
AnalyticsGrid Component
The AnalyticsGrid component is responsible for displaying business metrics.
Its primary responsibility is:
Render a collection of metrics.
This is achieved using:
metrics.map(...)
The map function transforms data into visual components.
Conceptually:
AnalyticsMetric[]→ Card[]
This demonstrates declarative rendering.
React does not manually create DOM elements.
Instead, developers describe what the UI should look like.
React handles the rendering process.
Why Fluent UI Matters
The application uses Fluent UI as the visual foundation.
Fluent UI provides:
- Microsoft design standards
- Accessibility compliance
- Consistent spacing
- Enterprise typography
- Professional appearance
- Keyboard accessibility
Rather than creating custom dashboard cards manually, we leverage production-ready components.
Examples used:
<Card /><Text /><Title1 /><Title3 />
These components automatically provide:
- spacing rules
- typography scales
- semantic structure
- enterprise styling
This dramatically reduces development effort while improving consistency.
Responsive Dashboard Design
One important feature of the AnalyticsGrid is:
gridTemplateColumns: "repeat(auto-fit,minmax(280px,1fr))"
This creates a responsive layout.
Behavior:
Large screen→ Multiple columnsMedium screen→ Fewer columnsSmall screen→ Single column
This allows the dashboard to adapt automatically to different screen sizes.
Responsive design is essential in modern enterprise applications because users may access dashboards from:
- desktop computers
- laptops
- tablets
- mobile devices
React Mental Model Applied
App 98 reinforces the React mental model introduced throughout the project.
React is not about manually manipulating the DOM.
React is about describing the desired UI.
The flow is:
Data→ Components→ JSX→ React Rendering→ Browser UI
In this application:
analyticsData→ AnalyticsDashboard→ AnalyticsGrid→ Fluent UI Cards→ Dashboard Interface
Every screen element is derived from data.
Why There Is No useEffect
One of the most important architectural decisions in this application is what was intentionally omitted.
There is:
- no useEffect
- no API calls
- no external synchronization
According to React Learn:
Effects should synchronize with external systems.
Since this app currently displays static analytics data:
No external system=No effect required
This follows modern React recommendations.
Many developers misuse useEffect unnecessarily.
This project intentionally reinforces proper React habits.
Enterprise Evolution Path
Although App 98 currently uses local mock data, its architecture is prepared for future growth.
Potential enhancements include:
Analytics API→ Data Services→ Authentication→ Filtering→ Search→ Export→ Charts→ Power BI Integration→ Real-Time Updates
This demonstrates why architecture matters.
The visual design remains stable while the data source evolves.
Technical Summary
| Concept | Purpose |
|---|---|
| React Components | Build reusable UI |
| TypeScript Models | Strong typing |
| Fluent UI | Enterprise design system |
| Analytics Dashboard | KPI visualization |
| Props | Parent-child communication |
| Data Rendering | UI generated from data |
| Responsive Grid | Adaptive layout |
| Component Composition | Scalable architecture |
| Dashboard Cards | Business metrics display |
| Declarative Rendering | React mental model |
What We Learned
By completing App 98, we practiced:
- Enterprise dashboard architecture
- Analytics visualization patterns
- Fluent UI dashboard layouts
- TypeScript data modeling
- React composition
- Data-driven rendering
- Responsive design
- Professional project organization
These skills directly transfer to:
- Power BI portals
- SharePoint dashboards
- CRM analytics
- ERP reporting
- Administrative portals
- Executive KPI systems
Official Documentation
React
Fluent UI
Vite
TypeScript
Final Architectural Insight
App 98 demonstrates a principle that appears in nearly every enterprise analytics platform:
Business Data→ Typed Models→ React Components→ Fluent UI Dashboard→ Decision Support
The application itself is simple, but the architecture mirrors real-world systems used by organizations every day.
This is why analytics dashboards are one of the most valuable React application patterns to master.
Current Progress
| Block | App | Name | Status |
|---|---|---|---|
| Block 5 | 94 | Corporate Catalog | Completed |
| Block 5 | 95 | Reservation System | Completed |
| Block 5 | 96 | Mini ERP Enterprise | Completed |
| Block 5 | 97 | CRM System | Completed |
| Block 5 | 98 | Analytics System | Current Article Completed |
| Block 5 | 99 | Admin Center Microsoft Style | Next |
| Block 5 | 100 | React Enterprise Platform | Upcoming |
Current Position: App 98 / 100 ✅
Next: App 99 — Admin Center Microsoft Style 🚀
