WP06 – Using ChartControl in SharePoint Framework (SPFx)
Introduction
The SharePoint Framework (SPFx) is Microsoft’s modern development platform for creating client-side solutions for SharePoint Online and Microsoft 365. SPFx enables developers to build responsive, secure, and maintainable web parts using technologies such as TypeScript, React, and Fluent UI.
Modern business applications rely heavily on data visualization. While tables are useful for storing information, charts allow users to quickly identify trends, compare values, detect anomalies, and make informed decisions. Dashboards, reports, project tracking portals, governance solutions, and business intelligence applications all benefit from effective visualizations.
The PnP SPFx React Controls library provides a powerful component called ChartControl. This control simplifies the integration of Chart.js capabilities into SharePoint Framework solutions, allowing developers to create professional charts with minimal code.
In this article we will create a simple SPFx web part that displays sales information using a bar chart.
Understanding ChartControl
ChartControl is a wrapper around Chart.js that integrates seamlessly with React and SharePoint Framework.
The control provides support for multiple chart types and allows developers to focus on business data rather than chart rendering logic.
Benefits include:
- Native SPFx integration
- React-based implementation
- TypeScript support
- Responsive design
- Multiple chart types
- Dashboard-ready visualizations
- Minimal configuration
- Easy maintenance
Why Charts Matter in SharePoint
Organizations store enormous amounts of information in SharePoint:
- Project status
- Task tracking
- Document metrics
- Site usage statistics
- Training adoption metrics
- Compliance indicators
- Financial reports
- Service management dashboards
Displaying this information as charts improves usability and decision-making.
Instead of reading dozens of rows in a table, users can immediately identify patterns and trends.
Supported Chart Types
ChartControl supports several visualization models through Chart.js.
Common options include:
Bar Chart
Useful for:
- Monthly sales
- Department comparisons
- Project counts
- Training participation
Line Chart
Useful for:
- Trends over time
- Growth analysis
- Performance monitoring
Pie Chart
Useful for:
- Percentage distribution
- Category breakdowns
Doughnut Chart
Useful for:
- KPI dashboards
- Resource allocation
Radar Chart
Useful for:
- Performance comparison
- Multi-dimensional analysis
Polar Area Chart
Useful for:
- Relative category comparisons
Project Scenario
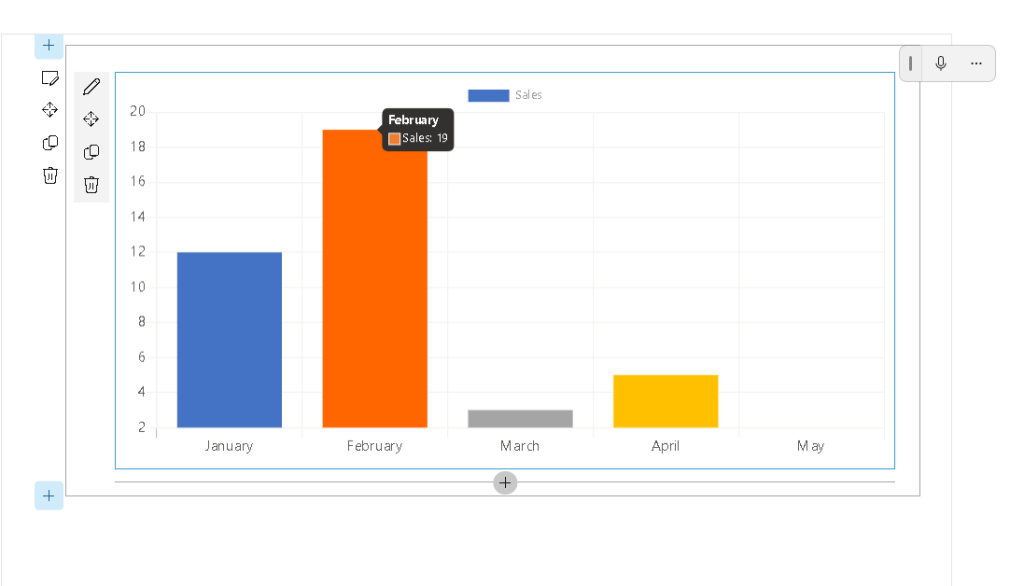
In this demonstration, the web part displays monthly sales values.
The chart contains five months:
| Month | Sales |
|---|---|
| January | 12 |
| February | 19 |
| March | 3 |
| April | 5 |
| May | 2 |
The data is stored inside a dataset object and rendered through ChartControl.
Installing the Control
The PnP React Controls library can be installed using npm.
npm install @pnp/spfx-controls-react --save
After installation:
npm install
Start the local development server:
heft start
Implementing the Component
The React component creates a dataset and passes it to ChartControl.
import * as React from 'react';import { ChartControl, ChartType} from '@pnp/spfx-controls-react/lib/ChartControl';export default function ChartControlDemoWp() { const data = { labels: [ 'January', 'February', 'March', 'April', 'May' ], datasets: [ { label: 'Sales', data: [12, 19, 3, 5, 2] } ] }; return ( <ChartControl type={ChartType.Bar} data={data} /> );}
This implementation intentionally avoids direct references to Chart.js types.
This approach is recommended for SPFx 1.23 environments because it prevents TypeScript declaration conflicts that may occur with different Chart.js versions.
Understanding the Dataset
The chart is driven by a JavaScript object.
const data = { labels: [ 'January', 'February', 'March', 'April', 'May' ], datasets: [ { label: 'Sales', data: [12, 19, 3, 5, 2] } ]};
The labels array defines the horizontal axis.
The data array defines the numerical values displayed by the chart.
Common Issue with SPFx 1.23
During implementation, the following TypeScript error may occur:
Could not find a declaration file for module 'chart.js'
This happens because newer versions of SPFx, TypeScript, Chart.js, and PnP Controls may not always align perfectly regarding type definitions.
The simplest solution is to avoid importing Chart.js types directly.
Instead of:
import { ChartOptions } from 'chart.js';
Use plain JavaScript objects:
const options = { responsive: true};
This eliminates dependency on Chart.js typings while preserving functionality.
Real World Business Scenarios
ChartControl is extremely useful in enterprise SharePoint solutions.
Examples include:
Governance Dashboard
Display:
- Site growth
- Storage consumption
- Document volume
Training Portal
Display:
- Course completion rates
- Monthly participation
- Certification progress
PMO Dashboard
Display:
- Project status
- Budget utilization
- Milestone completion
Help Desk Portal
Display:
- Open tickets
- Closed tickets
- SLA compliance
Compliance Dashboard
Display:
- Audit findings
- Risk indicators
- Policy adoption
Performance Considerations
When working with large datasets:
- Load data asynchronously
- Use REST APIs efficiently
- Minimize unnecessary re-renders
- Aggregate data before visualization
- Cache results when possible
These practices improve user experience and reduce page load times.
Integration Possibilities
ChartControl can consume data from:
- SharePoint Lists
- SharePoint Libraries
- Microsoft Graph
- Azure Functions
- Dataverse
- SQL APIs
- External REST Services
This flexibility makes the control suitable for virtually any reporting scenario.
Conclusion
ChartControl is one of the most valuable controls available in the PnP SPFx React Controls library.
It provides an easy way to introduce professional data visualizations into SharePoint Framework solutions without requiring developers to manually integrate Chart.js.
By combining React, TypeScript, SPFx, and ChartControl, developers can create modern dashboards that transform raw business data into meaningful visual insights.
For organizations building reporting portals, governance dashboards, project management solutions, or analytics applications, ChartControl is an essential addition to the SPFx toolkit.
Roadmap Progress
| WP | Control | Status |
|---|---|---|
| WP01 | AccessibleAccordion | ✅ |
| WP02 | Accordion | ✅ |
| WP03 | AdaptiveCardHost | ✅ |
| WP04 | AnimatedDialog | ✅ |
| WP05 | Carousel | ✅ |
| WP06 | ChartControl | ✅ |
Progress: 6 / 76 completed.
